I. INTRODUCTION
Hydroponics is a soilless plant growing method using mineral nutrient solutions in water, where soil is no longer required for the plant to thrive. Almost any terrestrial plant will grow in water. The two main merits of hydroponics are high crop yield and unlimited cultivation area where ground agriculture is not possible [1]. Different crops grow well at different levels of nutrient strength. Controlling this nutrient strength is important in providing the best conditions for the crop. Without proper measurement of the crop could fail from root burn brought on by too higher nutrient level, or death by natural causes from not receiving the vital elements they need to grow [2], [3]. This measurement is done in terms of electrical conductivity (EC); EC is the material’s ability to conduct an electric current. It is also important to maintain a hydroponic nutrient solution at a pH level with the elements in the nutrient solution consistently available to the plant [4]. If the solution is too acidic or too alkaline, it can cause lock up, a situation which restricts certain elements essential for growth from being absorbed by the root structure. Deficiencies in the required elements become apparent in the plants growth and can lead to crop failure. As a result, in order to maintain good crop yield, the pH and EC level of the hydroponic solution needs to be measured at least three times per day, which can be cumbersome if performed manually. This necessitates a smart sensing platform that can continuously monitor the water quality, and alter the user for abnormalities.
In this work, a smart water quality sensor platform that can continuously monitor the pH and EC level of the hydroponic solution, and provide update for the user is proposed. The smart sensor platform will contribute in making hydroponic plant growing simple, efficient, and user friendly.
II. SMART WATER QUALITY SENSOR PLATFORM
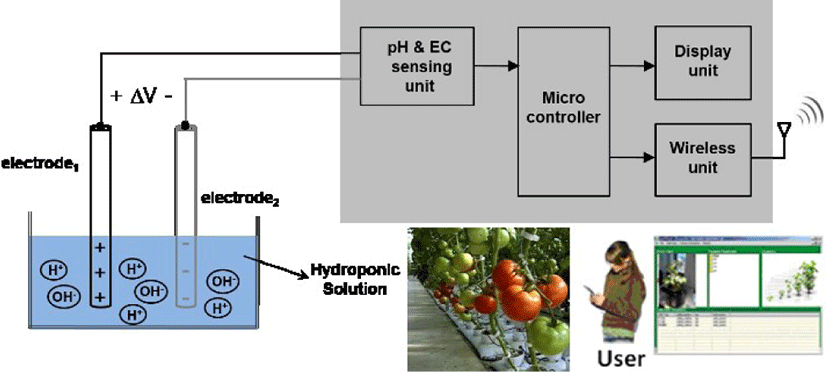
Fig. 1 shows the concept of the proposed smart water quality sensor which includes the sensor electrodes, pH, EC sensing unit, micro-controller, and a wireless unit (WiFi module). The pH and EC are measured using the same sensor electrodes, where each sensing unit generates an output that is sent to the micro-controller for further signal processing. This data can be displayed on the LCD and monitored using a smartphone or a PC through the wireless unit. Analog data is transferred from EC and pH sensor circuit output to the input of micro-controller. This data is converted into digital format using ADC of micro-controller. The micro-controller output is connected to LCD and Wi-Fi module using parallel and serial connection, and data is sent out in the digital format. Two linear regulators are used to provide the power supply to the amplifier, LCD, micro-controller and WiFi module. In addition, for the proposed application, linear regulators are preferred over switching regulators as it needs to just step down a single voltage and does not require stepping up or inverting configurations. The role of the micro-controller (PIC24FJ32GA002) is to sense the analog voltage levels from the pH and EC circuitry, and convert them to digital format using the ADC. The calculated values of pH and EC are sent to the LCD through parallel transmission and to the WiFi module through serial transmission. The sensor nodes can be used with routers that are serving other applications and it is possible to have applications running on a server or PC, communicating with one or more WiFi nodes. The WiFi module RN171 has 14 General Purpose Input/output (GPIO) pins in which four of them are shared with UART; it can be configured using simple ASCII commands. The RN171 can join infrastructure mode of networking and also can act as access point.
III. SENSOR HARDWARE
The two sensor electrodes shown in Fig. 2 are made up of different metals (Cu and Zn), where electrode-1 (Cu) has more positive atoms and electrode-2 (Zn) contains more negative atoms. The reduction process will dominate for electrode-1 and oxidation will mainly occur in electrode-2. As a result, positive ions will be released from electrode-2, which will make electrode-1 positively charged and electrode-2 negatively charged. Thus, the voltage difference between the two electrodes ΔV will be positive. The pH measurement will be based on the value of ΔV. The pH sensing unit will generate the pH of the solution from ΔV. For pH less than 7.0, there will be more H+ ions in the solution which will obstruct the positive ions being released from electrode-2. This makes electrode-2 less negative compared to electrode-1. On the other hand, for pH higher than 7.0, OH- ions will be dominant, and this will help the positive ions being released from electrode-2, which will make electrode-2 relatively more negative than electrode-1 [5]. Eventually, depending on the concentration of the H+ and OH- ions, ΔV will increase as the pH increases, and vice versa.
The EC of the solution is proportional to the conductivity of the solution, where the EC can be obtained from the resistance between the two electrodes. EC measurement is possible as far as the two electrodes are conductors. Fig. 3 shows the EC sensing circuit which consists of three stages. The first stage is a conventional square wave oscillator that generates a square wave. It is followed by amplifier stage and the simple peak detector circuit that converts the AC signal into a DC voltage. The square wave generator is like a Schmitt trigger circuit in which the reference voltage depends on the output voltage. In this design, the circuit is implemented using single-supply rail-to-rail op-amps OPA344PA (Texas Instrument Inc.) and some passive components. Generally, for measuring the conductivity of electrolytes, frequency less than 10 kHz is used. However, for hydroponic application the frequency is set to 250Hz. For the proposed circuit, resistors of values 3kΩ (R1) and 1kΩ (R2), capacitor of 33nF (C1) are used. Furthermore, the second stage amplifier is applying the square wave between the two electrodes with attenuating voltage divider R3 (100kΩ) and R4 (1kΩ). As the conductivity of the electrolyte changes, the equivalent resistance between two electrodes changes, and as a result, changes the peak-to-peak voltage of the second stage output which is given as
where RE is inversely proportional to the conductivity of the electrolyte.
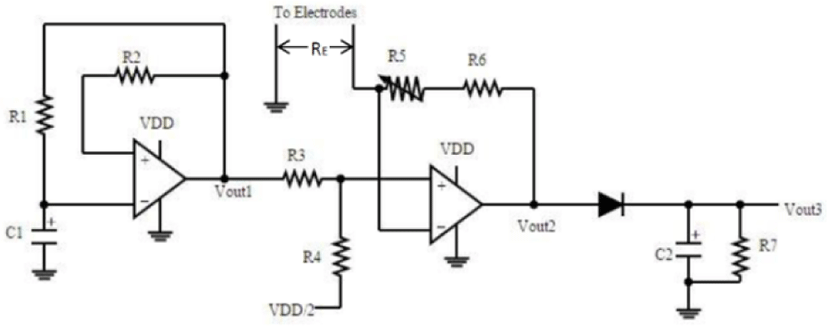
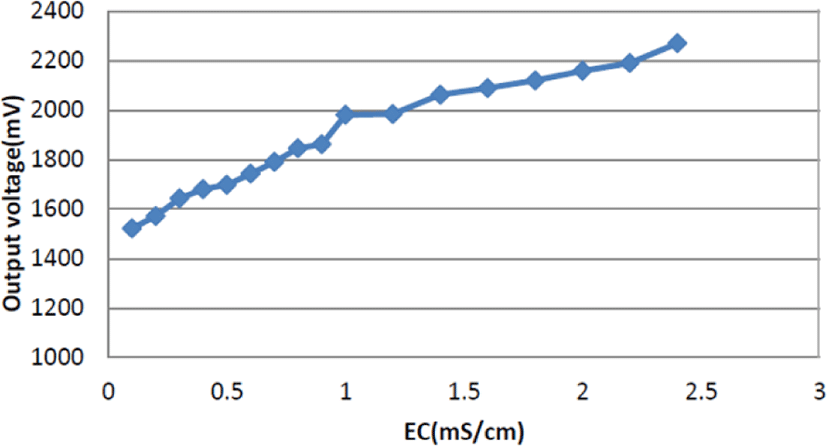
Since Vout2 is an AC voltage, it is converted into a DC value through the simple peak detector circuit. A capacitor with a diode can be used to rectify the signals, but to reduce the variation of the output voltage, a capacitor is placed across the load resistor. For an AC input, the capacitor charges to the peak of the input. Then the diode cuts off, and the capacitor discharges through the load resistance R7. The capacitor discharge will continue for almost the entire cycle, until the time at which input exceeds the capacitor voltage. Then the diode turns on again and charges the capacitor up to the peak of input level, and the process repeats itself. To keep the output voltage from decreasing too much during capacitor discharge, one selects a value for C so that the time constant RC is much greater than the discharge interval. Fig. 4 shows the measured output voltage of the EC circuit as the EC of the solution varies from 0 to 2.5.
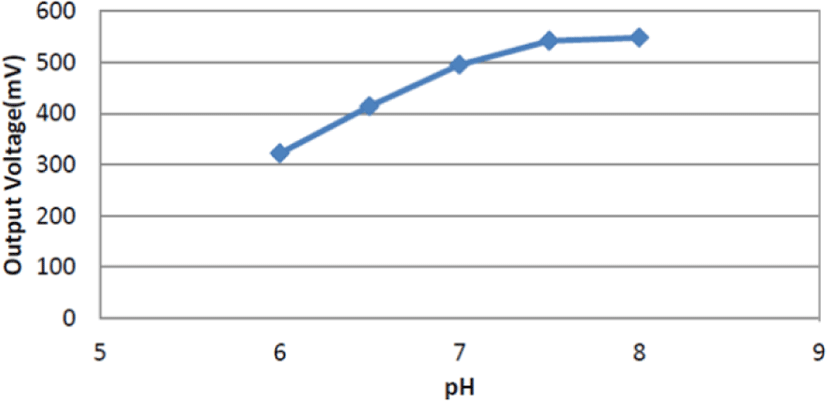
To measure the H+ concentration, ([H+]) or pH (pH= -log (H+)), a passive DC measurement approach has been used. Two different metal electrodes (Cu and Zn) produce voltage difference that is proportional to [H+] of the electrolyte. Zinc electrode is connected to ground terminal and the copper electrode is given as the input to the micro-controller, so that voltage difference can be collected and can be used to detect the corresponding pH level of the solution. Fig. 5 shows the measured output voltage of the pH circuit with pH change from 6 to 8.
IV. SENSOR SOFTWARE
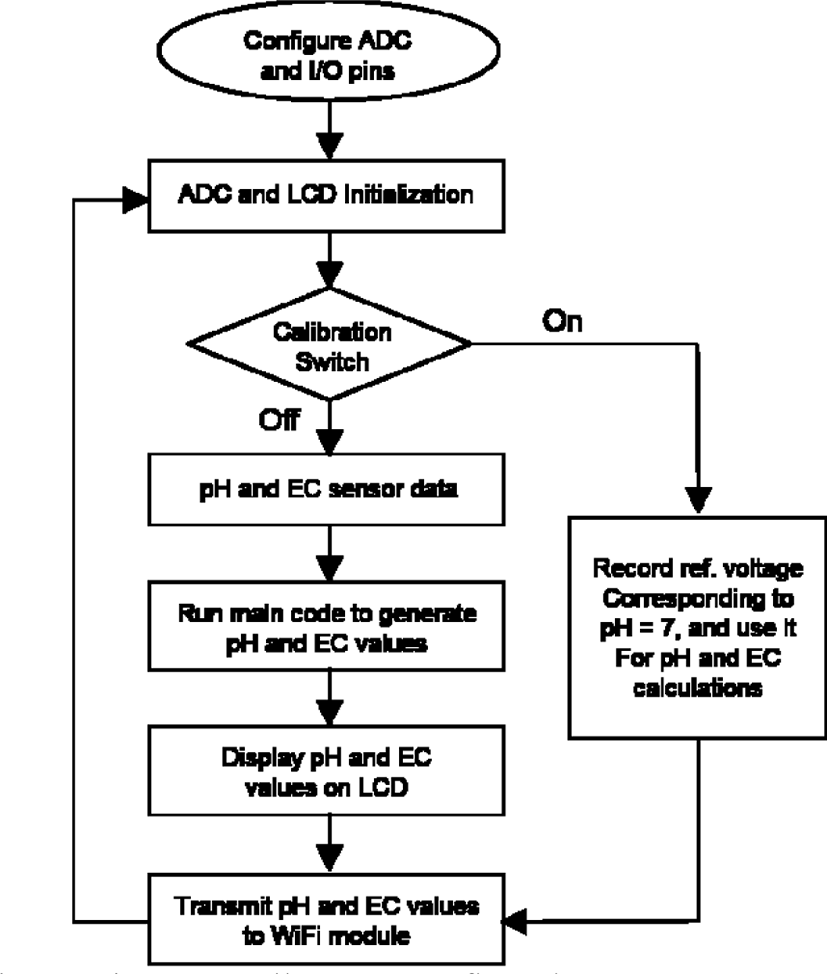
The micro-controller program is divided into four sections: first section deals with determination of pH and EC from the analog sensor outputs using corresponding equations, next section corresponds to the initial calibration of the sensor to the pH level of 7; it records the respective voltage to be used in the equations. Third section discusses the program for interfacing LCD module to the micro-controller. Last section of the code is to transfer output serial data from the micro-controller to the WiFi module. Fig. 6 is a flow chart that shows the operation sequence of the microcontroller program. First, the ADC control registers, I/O pins, registers, and timers are configured. A check for the calibration mode is performed. The main program consists of the user defined functions that receive and process the pH, EC sensor data, further this data is displayed on the LCD, and sent to the WiFi module. The loop for receiving and processing the sensor data continues as long as the power is supplied to the micro-controller.
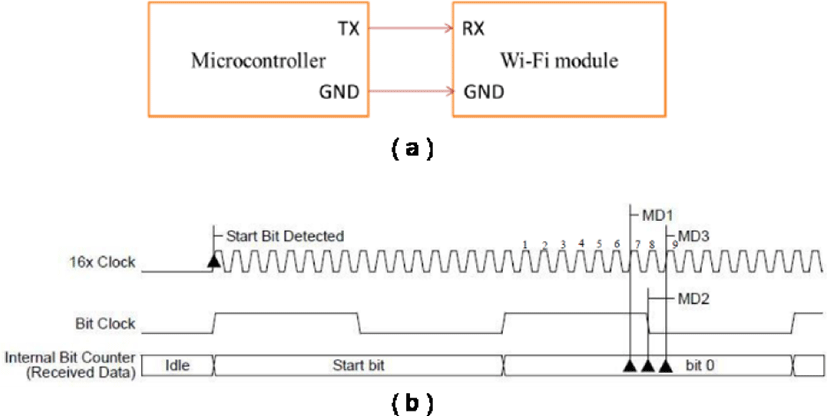
The pH and EC data processed from the micro-controller is transmitted to the WiFi module through asynchronous serial transmission. In asynchronous transmission, group of bits are sent as independent units with start/stop flags and no data link synchronization, to allow for arbitrary size gaps between frames. However, start/stop bits maintain physical bit level synchronization once detected. Fig. 7(a) shows the connection diagram of microcontroller and the WiFi module. The Universal asynchronous receiver transmitter (UART) module is one of the serial I/O modules in the micro-controller. The UART is a full-duplex, asynchronous communication channel that communicates with peripheral devices. The UART module consists of a dedicated 16-bit baud rate generator. 16x clock mode is used for data bit detection. In the 16x clock mode, each bit of the received data is 16 clock pulses wide. To detect the value of an incoming data bit, the bit is sampled at the 7th, 8th and 9th rising edges of the 16x clock. These rising edges are called majority detection edges and are shown as MD1, MD2, and MD3 in the Fig. 7(b).
The U1BRG register controls the period of a free-running, 16-bit timer. Below shows the formula for computing the baud rate with BRGH=0 (16x Clock Mode).
where Fp denotes the instruction cycle clock frequency (FOSC/2), FOSC is set to 8MHz. To achieve a desired baud rate of 9600, U1BRG is set to 25.
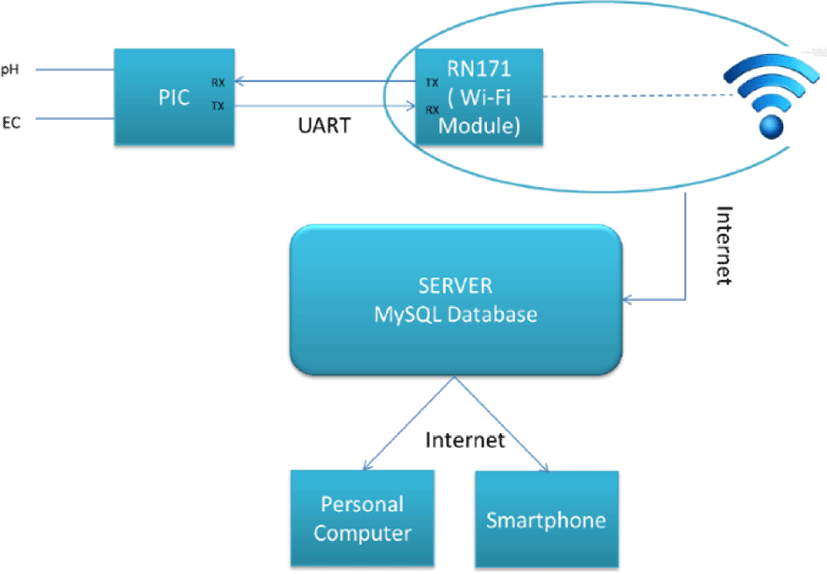
Fig. 8 shows the block diagram of the sensor data flow. The WiFi module has two modes of operation: data mode and command mode. In the data mode, the module can accept incoming connections or initiate outgoing connections. To configure parameters and/or view the current configuration, you must put the module into command mode (also called configuration mode). To interact with the WiFi module through the PC, a terminal emulator Tera Term is used. By default, the module is in data mode after power up. Sending the escape sequence $$$ causes the module to enter command mode. The module is configured using commands to join a network automatically when it is powered. The module has a built-in HTML client. When enabled, the module can get or post data to a web server. Using the auto trigger UART mode when the serial UART data comes in, the module automatically connects to the web server and sends HTML header in ASCII format with the sensor data having size of nearly 80 bytes. A PHP script is written to identify the respective sensor data (pH and EC) and store it in corresponding column of the database [6].
The PC and mobile interface includes frontend and backend tools. The frontend tool is a client-side interface realized with HTML and java-scripts. The backend tool is a server-side interface with database developed using PHP and MYSQL. The frontend page scripts include login.htm, register.htm, notify_set.htm, notify_add_mod, and data.htm. The backend server scripts are register.php, member req.php, and auto.php. Between the client-side and the server-side, action.php and dbcon.php classify the request from the users, and directs to the right server side script function. The dbcon.php script sends MYSQL query to the server to make a connection, retrieve, and update the data. The web server and MYSQL database domains are host by
The PC and mobile interface is categorized into three modules - user management, notification management, and real-time graph. The user management module enables the sensor platform to register new users, where user ID, encrypted password, and contact information (email or phone) are saved into the database by calling the server side script register.php. However, the existing users are distinguished by their own RID which are numerical identification automatically created when they are registered in the system. The existing users can login through login.htm, and register their water quality sensor unit on notify_add_mod.htm. This also enables users to setup the notification by adjusting the pH, EC limit range, and the preference date. Furthermore, users can add, delete or update the notification setup for each sensor unit on notify_set.htm. The requests generated from user management and sensor management modules are sent to register.php on the server side through action.php. The main feature of the PC and mobile interface is monitoring the real-time data by graphs. The graph on data.htm enables users to set the preference dates (“today”, “yesterday”, “last seven days”, “this month” and “last month”) to view the real-time data produced by the sensor. The RID of the users, dev_id of sensors, and the pH, EC range from data.htm are used to retrieve a correspond graph from the web database via member_req.php. For the daily-based graph, the data is retrieved and displayed in hour scale with calculating an average value of data for each hour. For the monthly-based graph, the data is retrieved and displayed in day scale by sorting the maximum and the minimum value for each day. This process is performed by the server side script member_req.php with sending SQL query to the web database.
V. SENSOR TEST RESULTS
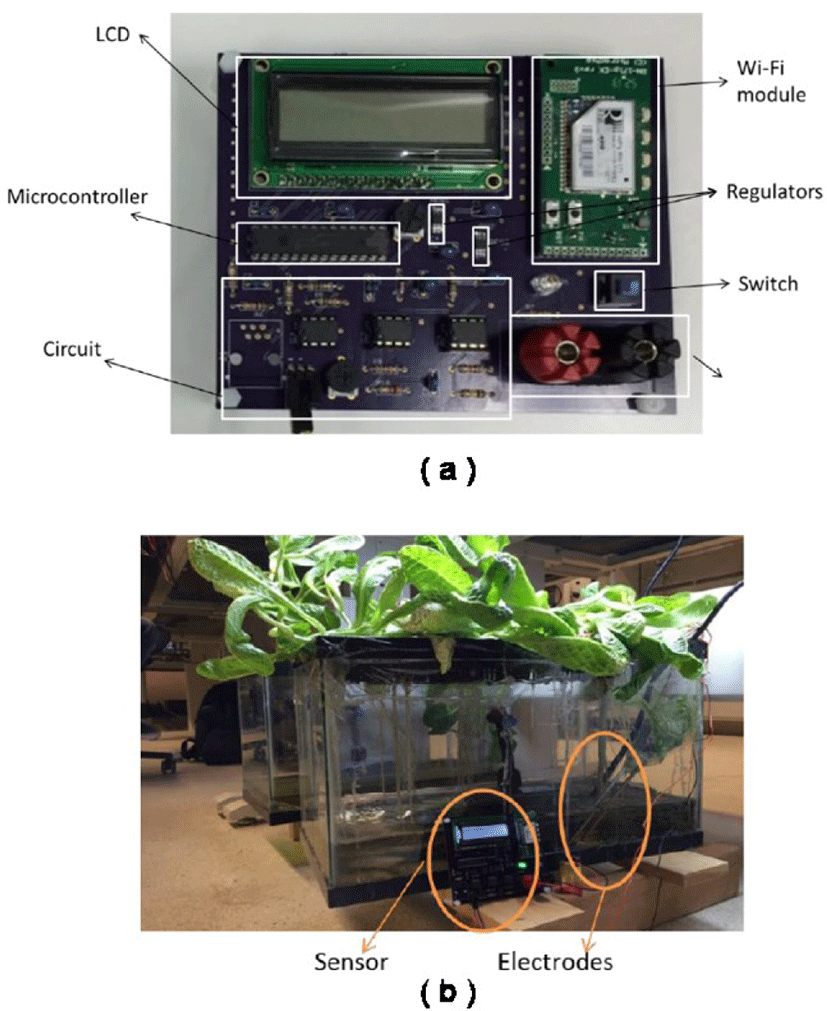
Fig. 9(a) shows the fabricated smart sensor platform which includes the pH, EC circuits, LCD display, micro-controller, and WiFi module. The pH and EC electrodes will be connected the pH and EC circuits. In order to test the remote sensing operation, sensors are installed in two hydroponic lettuce growing tanks as shown in Fig. 9(b). The tank consists of water pump and sprinklers inside it and plant media is arranged to support the growth of the plants. The WiFi module which is part of the sensor connects to the available local WiFi network and updates the webserver database with the pH and EC values, which can be viewed remotely through the PC or smartphone.
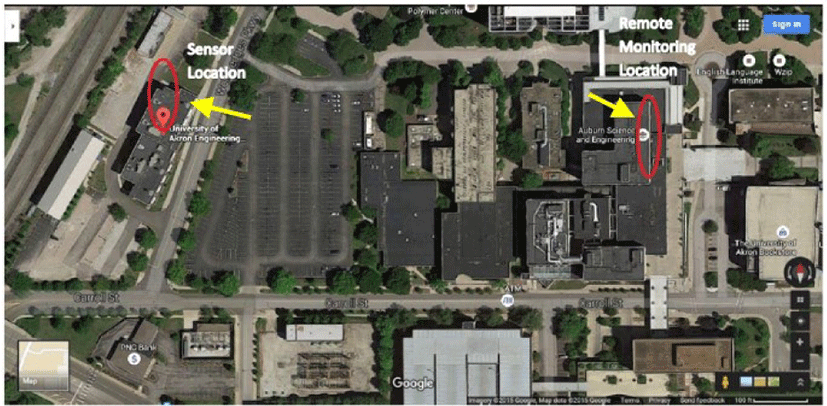
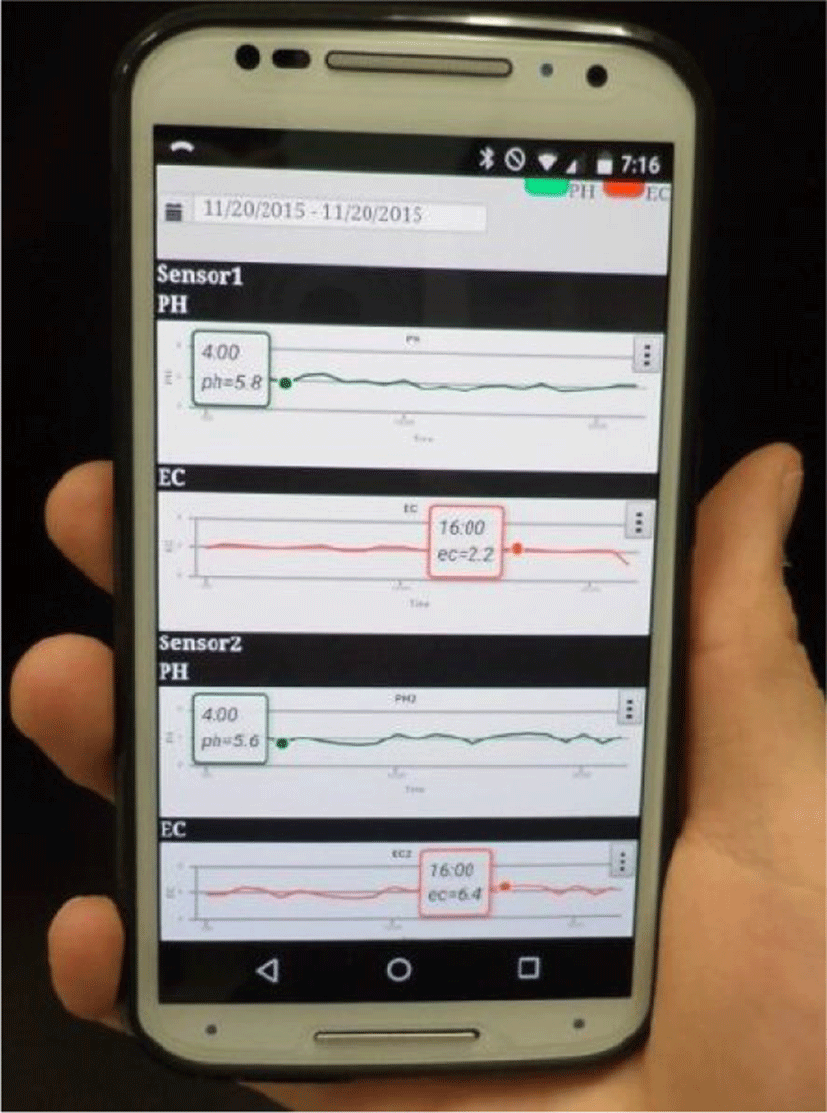
The hydroponic lettuce growing environment is set up in the laboratory at Engineering Research Center and the sensor pH and EC values are remotely monitored from the Auburn Science and Engineering Center (both buildings are about 500m apart) as illustrated in the Fig. 10. In addition, the sensor data is viewed through the smart phone using the mobile interface and app. Fig. 11 shows the pH and EC graphs shown on the smart phone, where the graphs are obtained from two sensor units.
VI. CONCLUSION
In this paper, a smart water quality sensor for hydroponic plant growing applications is proposed. The proposed sensor can effectively measure pH level and electrical conductivity of the water solution. The micro-controller incorporated in the sensor processes the raw sensor data, and converts it into a readable format. In addition, through the mobile interface realized using a WiFi module, the sensor can send data to the web server database that collects and stores the data. The data stored in the web server can be accessed by a personal computer or smart phone. The prototype sensor has been implemented, and the operations have been verified under an actual hydroponic plant growing application.


