I. INTRODUCTION
Recently, the transformation of the Fourth Industrial Revolution [1] has become an important keyword for us. And the major core industry of the fourth industrial revolution is big data, and technology to store, analyze and apply big data is getting popular. After a period of emphasis on the importance of Big Data, technology to actually handle Big Data has become a real need. Big data processing technology is data analysis technology. The data analysis technology through artificial intelligence is attracting major attention in various industrial fields. In addition, with the increase in personal income, nowadays, the importance of heterogeneous leisure life is becoming more prominent [2].
The most important industry in the leisure and leisure industries is the tourism industry. The tourism industry is attracting attention as a future industry that relieves stress accumulated in complex and diverse lives.
In the tourism industry, recently, demand for overseas tourism is continuously increasing. However, there is a problem that the tourism industry is not out of the traditional service framework. For the ultimate development of the tourism industry, it is time to provide more scientific and systematic tourism services. The tourism industry still uses traditional business analysis and marketing methods, and it is only interested in what kind of services the people engaged in the tourism industry are interested in. Thus, it is an important problem in this field.
This paper proposes the following two contributions. First, define service items for airline customers that are important in tourism. The definition is divided into large classification, middle classification, and small classification. The major categories are Air Fare Satisfaction, Service Satisfaction in Airplane, Service Satisfaction before Airplane, and Service Satisfaction after Airplane. High-grade air fares, Non-high season air fares, In-flight customer service, Reservation service, Basic reliability. The subclass is a detail item for each middle class. This classification is to define the service satisfaction attribute, which is defined first, and a new service item can be added later in the classification.
Second, the collaborative filtering technique in the field of computer science are applied to the field of tourism to realize next generation tourism services. This method is a kind of Supervised Machine Learning, a way to supply data for a certain decision, and to find the relationship between them. For this purpose, based on the “measured preference (or evaluation result) data” existing between certain customers and items (attributes), the result data can be predicted. In this way, we have presented a method for more accurately grasping the specific customer's tendencies as the customer collects more of the big data, if the customer can predict what he did not know.
To this end, the scope of this study is limited to the aviation service, and a natural ecosystem of the aviation industry for future-oriented services of aviation tourism that can improve the efficiency of aviation service gradually is established.
Two of the proposed contributions are firstly related to the airline industry in the tourism industry and secondly, it is technology in the computer science field in the information industry. In other words, the two fields are merged into one, and new information is derived, and it is reapplied to a new customer attraction scheme, so it can be said as a field convergence paper to create new added value.
The proposed method effectively solves the problems of traditional aviation services through data analysis techniques with artificial intelligence techniques in computer science. We expect that it will enhance the customized satisfaction of customers through personalized service and foster loyal customers in aviation companies through the method proposed.
II. RECENT AIT TRANSFORT TRENDS & ANALYSIS
According to the statistics of the Korea National Statistical Office (KNSO) in 2016, aviation passengers are expected to record the highest achievement of 100 million passengers with the growth of low cost airlines (LCC), expansion of air routes and flights, low oil prices and fuel surcharges In particular, international passengers achieved 70 million passengers due to an increase in domestic travel demand and an increase in foreign tourists. Table 1 shows the Summary of air transportation performance [3].
In 2016, the number of air passengers (10,391,000) increased due to the expansion of low-cost airline (LCC) routes, the supply of cheap airline tickets and the imposition of international fleet surcharges, And 16.2% year-on-year due to the base effect.
Air cargo (4.07 million tons) in 2016 is expected to decline due to lower costs due to falling oil prices, an increase in the imports and exports of other plastic products and flat panel displays, an increase in special transport cargoes such as clothing and cosmetics, Compared to the previous year
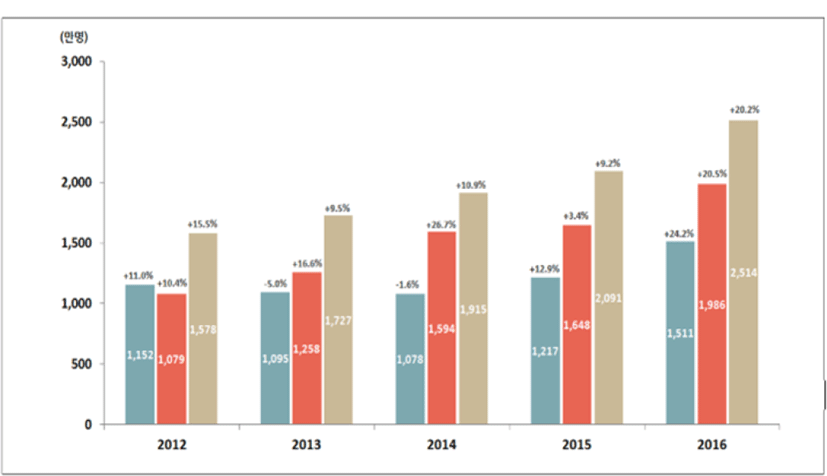
In 2016, international passengers have posted record highs. By region, international passengers by region in 2016 increased by more than 20% in Japan (24.2%), China (20.5%) and Southeast Asia (20.2%). Major countries are as follows.
Firstly, Southeast Asia is expected to expand in the following years due to: (1) expansion of low-cost airline’s overseas new routes and flights, (2) preference of locals to Southeast Asian resorts, and (3) Compared with 20.2% of passenger growth.
Second, China showed a 20.5% increase in passenger growth compared with the previous year, due to the high growth rate from June to August due to the base effect of the 2015 Mercedes.
Third, Japan is the country with the highest rate of increase, with the exception of the 1.0% decrease in May 2016 due to the earthquake in the Kyushu region. As the yen weakens and the number of airline flights increases, Due to the increase in tourism demand, the passenger growth rate was 24.2% compared to the previous year.
The following Table 2 shows the correct information for the above description.
The following Figure 1 shows international passenger traffic trends for Japan, China and Southeast Asia from 2012 to 2016. The horizontal is the year, the vertical is the number of people, and the unit of the number of people is ten thousand.
Looking at the number of passengers by airline, the number of international passengers increased by 8.0% and the boarding rate increased by 2.6%.
Low-cost airlines (LCC) increased 59.5% in international passengers and 2.8% p increase in boarding rates. Korea's airlines accounted for 64.7% of passengers, 45.1% for large Korean airlines, and 19.6% for low-cost airlines (LCC), a 5.0% increase over 2015.
The following Table 3 shows the change of passenger flight by airline.
As mentioned above Table 3, the air transportation trends in 2016 are summarized as follows.
First, despite the global economic uncertainties such as sluggish emerging economies such as economic slowdown in China and slowing economic growth in Britain, and brake-sheets and terrorism in the UK, the number of airline passengers in 2015 is expected to decline due to the increase in the number of flights operated by low- ), The number of overseas tourists increased, (2) the increase of foreign tourists due to the proliferation of Korean Wave, and (3) the increase in tourism demand for domestic and foreign Jeju routes.
Second, air cargo is expected to decline due to falling oil prices, an increase in the number of airlines' freighter operations, an increase in freight demand centered on Southeast Asia and China, an increase in freight transportation of other plastic products and flat panel display imports, And the increase in freight rates.
The future outlook for the air transportation market is as follows.
First, the air transportation market is expected to maintain steady growth for both passengers and cargo on the back of increased domestic and foreign travel demand, new airline routes, and co-operation.
Second, the passenger side of the airline. In the future, air passengers will be able to increase the number of passengers by increasing the number of high-cost airlines (LCC), expanding routes through co-operation, expanding routes through international flights, both international and domestic passengers are expected to continue to grow on the back of growing domestic and foreign Jeju travel demand. For reference, the International Air Transport Association (IATA) forecasts that Korean Air passengers will grow at a CAGR of 8.1% by 2020 in the Air Passenger Forecast 2015-2020 [3].
Third, air cargo side. In the future, air cargo traffic is expected to continue to grow modestly on the back of increased demand for e-commerce special transportation cargo and cargo to maintain freshness, and the launch of premium smartphones and large flat panel displays.
III. COLLABORATIVE FILTERING IN AIT TRANSFORT
Collaborative Filtering is a kind of Supervised Machine Learning, a way to pre-provision data for certain decisions and to discover relationships between them. For this purpose, based on the “measured preference (or evaluation result) data” existing between certain customers and items (attributes), the result data can be predicted [5].
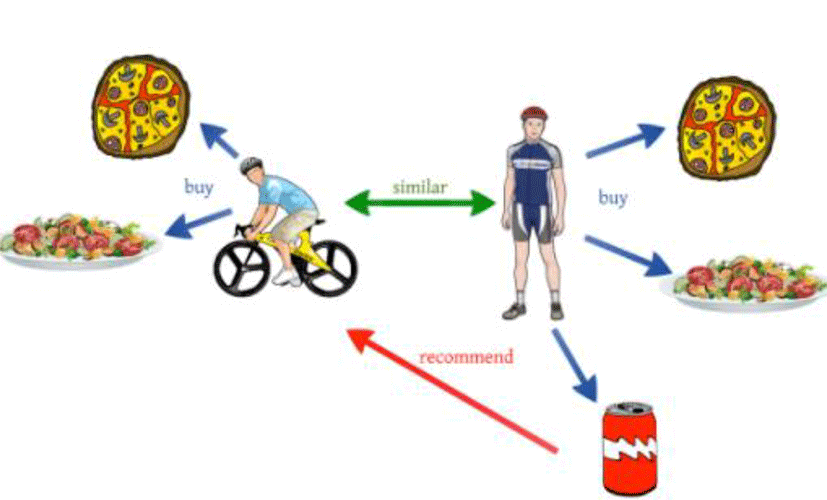
The following Figure 2 has borrowed the picture expressed in [1] to describe Collaborative Filtering. Figure 2 would it be appropriate to recommend a drink to the customer on the left? The paper want to solve the problem of. Collaborative filtering can be used at this time. If the customer on the left and the customer on the right select Pizza and Salad at the same time, and the customer on the right has ordered additional drinks, the customer on the left is likely to order drinks, too. It would be better to recommend a drink order to the customer on the left [4].
So, as a result, if the customer on the left orders drinks, the restaurant will see an improvement in sales. Therefore, Collaborative Filtering uses already measured attribute data existing between certain customers and items (attributes) as the base knowledge, and for the attributes that are not known at present or have not obtained the results of preference evaluation so far, However, the method can be usefully used as a method for predicting customer's purchase intention.
In this study, we will apply the Collaborative Filtering method to the main attributes of the airline service. Through this, we intend to use the Collaborative Filtering method as a way of determining what information to recommend to a customer.
Table 4 below lists the service attributes (attributes) that can be measured in air travel. The attributes proposed below are proposed in this paper, and additional items may be proposed in a later paper. This paper is based on the following items (attributes).
Labels in Table 4. indicates as follows: (H1) Satisfaction of First class air fares in high season, (H2) Satisfaction of Business class air fares in high season, (H3) Satisfaction of Economy class air fares in high season, (NH1) Satisfaction of First class air fares in Non-high season, (NH2) Satisfaction of Business class air fares in Non-high season, (NH3) Satisfaction of Economy class air fares in Non-high season, (IA1) Service kindness in In-flight customer service, (IA2) Service Quality in In-flight customer service, (IA3) Cleanness Degree in In-flight customer service, (IA4) Food Satisfaction in In-flight customer service, (BA1) Efficiency or Goodness in Online Reservation Service or System, (BA2) Efficiency or Goodness in Off-line Reservation Service or System, (AA1) Time accuracy in Departure / arrival time, and (AA1) Guarantee rate of Customer baggage.
Figure 3 below shows an example of the function of the Collaborative Filtering Method. It is assumed that the landscape expresses “property to be evaluated” that air travel customers consider important when using the aircraft for various purposes. The vertical is assumed to be the “customer unique number” of the air travel customer. In this situation, suppose that the “customer i” and the “customer j” that can be viewed vertically are given the same rating, that is, the letter ‘R’, which means that they have completed the evaluation, in the evaluation attributes 1, 3 and n. At this time, for the customer having the customer number “customer i ”, we want to know the evaluation score of the “n-1” th evaluation target attribute.
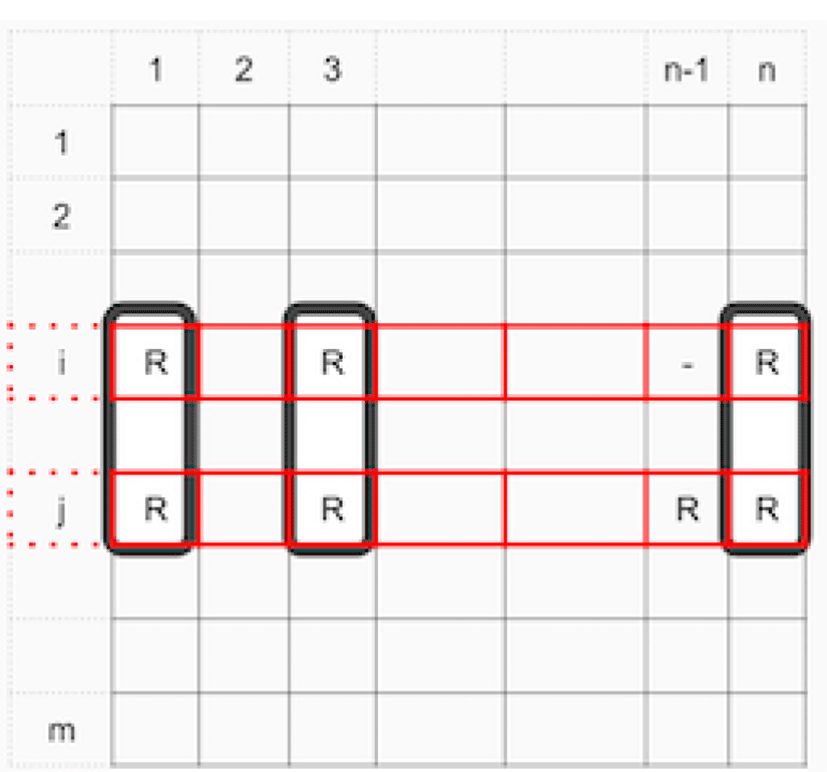
However, “customer i” did not evaluate the “n-1”. Therefore, we will not know what “customer i ” will do to the “n-1” th evaluation attribute. However, as introduced in the previous section in Figure x1, if the same score types were seen in the items evaluated at the same time by both customers “customer i ” and “customer j”, the “n-1” It can be judged that there is a high likelihood of a similar evaluation for the property to be evaluated. Therefore, we can predict that for the “n-1”th evaluation object attribute that is not evaluated by “customer i”. In this way, if we make predictions about unknown blank, we can judge that the more customer data is gathered, the more accurate the customer's tendency can be.
IV. ADAPTATION RESULT OF COLLABORATION FILTERING
In this chapter, we show an example of applying the proposed method shown in Figure 5 as an attribute item proposed in Table 4. Through this, we explain how the proposed method works and what effect it will have.
Figure 6 in below shows an example of applying the Collaborative Filtering Method to the air service item.
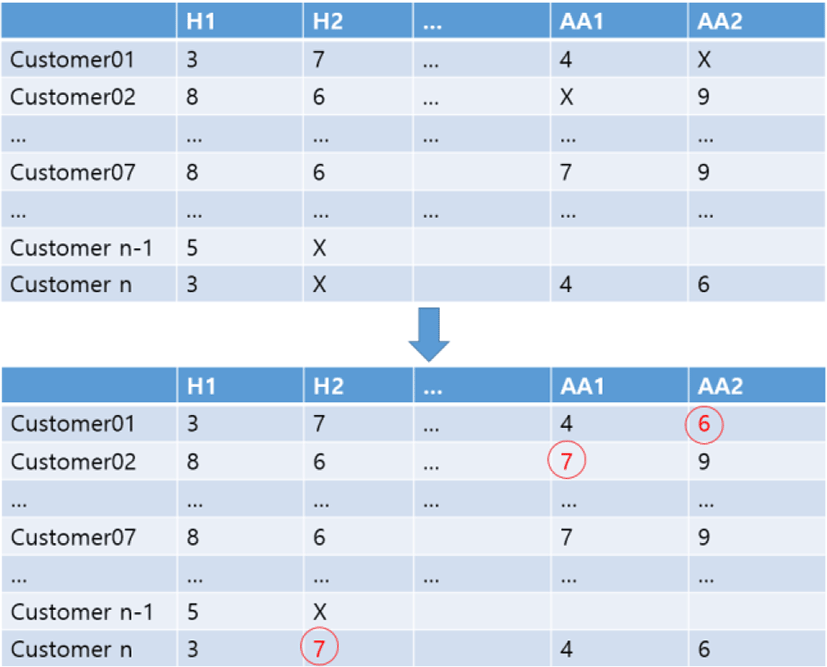
The landscape in Figure 4 represents the “attributes to be evaluated” that air travel customers consider important when using the aircraft for various purposes. H1, H2, …, AA1, and AA2 are the service evaluation items shown in Table 4 of Chapter 3.
The vertical in Figure 4 is the “customer unique number” for air travel customers and represents n customers. n customers indicated their service satisfaction in the horizontal service item. The lowest point of satisfaction is 1 point, and the highest point is 10 points. Among customer service evaluation items, there is a part marked ‘X’ as shown in Figure 4. This part is where the customer did not receive the evaluation information. These parts cannot get accurate information. However, by applying the collaborative filtering method proposed above, it is possible to deduce the information indicated by the circles as shown in the lower part of the arrow in FIG.
The analogy of this information is derived from the information of other customers, which was not known before. It is meaningful to be able to know the unknown information. This information can be used to understand how various services provided by the airline will provide satisfaction to the customer.
The reason for this is that, based on the existing selection information of a customer A, he has found an implicit satisfaction of the customer B who has a tendency similar to the customer A’s. This implicit satisfaction is the basis for recommending a new service to customer B. Therefore, it can be said that it is meaningful not to give an arbitrary service to an arbitrary customer, but to give a satisfactory service to the corresponding customer.
V. CONCLUSION
Recently, the importance of heterogeneous leisure life is becoming more prominent. However, there is a problem that the tourism industry is not out of the traditional service framework. This paper is focused on the problem. This paper adapt collaborative filtering method in computer science field to seek the aviation service information in tourism industry.
The proposed method effectively solves the problems of traditional aviation services through data analysis techniques with artificial intelligence techniques in computer science. We expect that it will enhance the customized satisfaction of customers through personalized service and foster loyal customers in aviation companies through the method proposed.
This study is a study which has a great significance in solving the problem of measuring customer's satisfaction about service which is considered to be very important in the aviation industry through the method of machine learning rather than the traditional method.