I. INTRODUCTION
In day-to-day life we came across many documents. Usually most of these contain defects and degradations such as complex backgrounds, non-uniform intensity, shadows, bleed through ink, aging, ink fading, holes. Additionally, these may carry some spots from the acquisition source from where the document has been taken and some environmental conditions [1]. Now a days digitizing the documents has become a usual practice. In this process, to capture the image of any document scanner and camera are the important hardware. Noise and blur can be originated by some situations such as environment condition, image sensor problem, due to miss-focus, motion, and transmission channel. Noise can also be induced in the document from the sources like printing on low quality paper, printing by old printers and old photocopying machines, images taken by portable cameras such as mobile phone camera or webcam of laptops. Restoration of morphological information of the document’s image is an important tool to improve the efficiency of OCR systems [2]. For noised document image analysis, pre-processing is always required for removing of isolated noise pixels and recovery of morphological structure of characters in a document image [3-4]. Thus, pre-processing is first most useful step to enhance the performance of OCR systems [5].
There are plenty of manual approaches for document smoothing which can be replaced by an automatic process. Here, it is to observe that the filtering should not be applied blindly as one filter does not suitable to all type of noises. One type of filter may be unable to remove all type of noise and, it causes the filtering process to be unsuccessful. There may be some situations like either the type of noise which is to be removed does not exist in the noisy image of the or the strength of the filter may not be suitable for the removal of noise [6]. Additive Gaussian noise may be reduced using average filtering. Holes and stains may be removed using high-pass filtering. Noise can also be reduced using adaptive binarization techniques. A good noise cleaning system can be built if we could have a realistic noise model. In real scenario, there are small, connected regions of black pixels of varying shape and size scattered randomly over the whole document image. They may be concentrated at one place or the other there is no ordered arrangement or pattern that they follow.
Noise in the image can be characterized by several noise models like Gaussian, salt and pepper, Rayleigh, and sinusoidal noise etc. as described in literature [7]. So, it will be a good practice that first to identify the noise type then employ the apt filtering approach. In order to eliminate the noise from the document image, the identification of the types of noise and their classification is utmost important phase [8]. But to characterize and classify the noise type then initiate apt filtering operation automatically is a difficult process as the image of the document may contain several noises. The title of each paper is expected to cover the whole contents of the paper and it should as concise as possible.
The proposed algorithm removes noise while retaining morphological elements. Based on experimental results, this work proved that the proposed algorithm produces better quality images compared with Weiner, median, and average filtering methods.
II. REVIEW OF LITERATURE
While reviewing the work carried out fellow researchers, it is observed that there are mainly two approaches to sanitize the noise in document images using filtering process. One of them is human classification based and other is based on the batch application of the image filters.
Fellow researchers in [9-12] carried out the work based on human classification approach for denoising the document image using filtering process. Characterization of the noise depends on the certain properties like shape, position, grey values, and noise frequency in the document.
Ink blob noise, marginal noise [13], salt-n-pepper noise [14-15] and complex background binarized patterns have been categorized using rule-based features. The noise having consistency with respect to these properties is known as regular noise [16-17]. However, in [18] the authors used grey level to differentiate between foreground from background [19-21]. Parker et al. [22] suggested a method which based on local intensity gradient. The presented method makes the differentiation between a pixel and its neighbors by finding the contrast in the grey level. Some techniques for removal of large size blocks of noise based on heuristic rules were also presented by the researchers in [23-24]. Techniques based on window for morphological filtering for the removal of small size noise blocks were also introduced [24]. The methods described in [25] were used to eliminate salt and pepper noise from a document image with character, graphics, and a dithered area that was created using the activity detection method. However, this algorithm was unable to remove noise speckles adjacent to graphical elements since these elements have been considered as apart of graphical element.
Moreover, noisy grey level images were used to extract the entire shape of handwritten data using a multi-scale technique. The intensity difference of strokes of spatial scales have also mitigated in this approach [26]. In a similar way, [27] developed an approach based on a noisy spot model with Gaussian spatial and grey value. A simple yet powerful model of show-through effects has been constructed, and the use of adaptive linear filtering has been demonstrated employing scans of both sides of a document image in processing [28]. Some other techniques for marginal noise [13] and show-through effects [29] have been studied in the literature. A robust frame extraction method has been proposed in [30-31] to sanitize the noisy document image. Chang et al. [32] proposed Connected Component Labelling based approach for noise removal. In [33] an iterative method using k-means algorithm has been discussed to eliminate the noise from the document using principal component analysis technique. Al-Khaffaf’s approach for elimination of salt-and-pepper noise from binarized image of engineering drawings to segregate the neighborhood of thin lines before removing the noise [34].
Furthermore, some algorithms for denoising the noisy image based on heuristic approach were discussed in the literature [35]. However, it is evident from these studies that these heuristic approaches for denoising can solve the problem using heuristic search. The studies presented in [36] found the use of Markov Random Field (MRF) in image restoration is successful. Therefore, fellow researchers applied the MRF as pre-processing tool for the text region of degraded images [37-40]. These studies show that the MRF model’s efficiency is better than heuristics approaches, and I strongly believe the reason for this that the MRF describes the probabilistic dependency of neighboring pixels [41-45]. In [46] Huang et al. proposed an advanced noise reduction and enhancement technique with the help of three modules namely deep image prior (DIP) based module, image fusion (IF) module and progressive refinement (PR) module. The DIP-based module is used to learn contrast information and to remove the noise present in the image. Next, the IF module which is based on Laplacian pyramid decomposition is applied to deal with shifting of color and amplification of noise during image production. At last, the PR module is used for improving the edge information for generating noise free high-quality image.
Kim et al. [47] presented an approach of automatic fingerprint verification system based on the block processing scheme that include adaptive normalization method. Obtaining an improved fingerprint picture, the region of interest of the fingerprint image is acquired after an input image is divided into sub-blocks with the size of KxL. The settings for picture normalization are then adaptively chosen in accordance with each block’s statistical data. The block picture is normalized using these parameters for the subsequent step. The approach was evaluated using the NIST fingerprint images, and their outstanding performance is confirmed.
Kim et al. [48] proposed a quick method for segmenting images based on wavelets transform and feature distribution applied to several resolutions. In order to quickly calculate the ideal threshold values in a feature space, wavelets transform is used to reduce the resolution of the original feature space. One or more feature values are chosen as the best threshold values based on this lower resolution version of the given feature space. After that, the lower resolution’s optimal feature values are projected onto the original feature space. To find the best threshold values, a refining procedure may be added. Results from the experiments demonstrate that a Kim et al. method is faster and effective than Otsu Method.
In [49] llesanmi et al. presented a detailed study of various methods used for denoising using CNN. The work discusses the denoising techniques mainly for two categories of images—denoising for general images and secondly denoising for specific images a large number of CNN approaches have been studied along with different CNN image datasets such as ImageNet, Places2, Berkeley Segmentation Dataset etc. In [50] Thakur et al. analyzed various image denoising techniques on the basis of PSNR quality assessment metric. The results of best denoising techniques have been discussed for different types of noises. For instance, it finds that GCBD, PReLU, and BRDNet perform well for Gaussian kind of noise in the literature. For Poisson type of noise, MC2RNet and CNN+LSTM are most suitable. Similarly, to deal with impulse type of noise removal Blind CNN, and CNNCPSO did outperformed. For mixed type of noise removal, CNN, EM-CNN, SDL and mixed CNN are most suitable. Apart from it, DDFN and GRDN denoiser have shown accurate performance in real word denoising.
Median filter is used extensively in denoising the noisy image. This filter is a spatial nonlinear filter that can remove the noise especially salt and paper noise effectively [38]. The filtering using this filter is performed by shifting the center of the window by the median of the neighborhood of the window center. However, this filter is less efficient to preserve corners and thin lines in a document image [39]. The median of a set can be defined as the middle value of the sorted set and for even numbers in the set of the values, the median is the mean of the middle two. The merits of the median filter are given below:
The Weiner filter is used for adaptive filtering which provide better results than the contemporary linear filtering. It is observed that this filtering not only preserves the edges of the document image but also effectively preserves the high frequency regions in the image [40]. The Weiner filter works on the statistical parameters of the image and found useful in restoration of the blurred and noisy image having stationary noise. However, most of the images contain nonstationary noise where the performance of this filter is found unsatisfactory. For document images, the nonstationary noise can be defined as large constant regions segregated by sharp transition [44].
From a greyscale image ‘Is’ the Weiner filtering can be performed as in equation (1):
The merits of the Weiner filter are given below:
-
1. Wiener filter is the linear estimation of original images.
-
Wiener filter removes the additive noise and at the same time it inverts the blurring.
-
Wiener filter is able to control the error.
-
During the noise smoothing and inverse filtering it tries to minimize the mean square error.
-
It may analyze the statistical behavior of the signal.
Here the variable μ represents the local mean, and the estimated variance is represented as σ2 and ν2 represents a mean of all estimated variance of all pixel in the neighborhood of 3×3.
Averaging filter is useful to clean Gaussian noise which is an identified mathematical model for white noise. Generally, it is caused by random variations in the signal [40]. The Probability density function (PDF) for this noise is presented in equation (2):
Here the variable z represents grey level and the variable μ is the mean of average of the variable z. The parameters σ and σ2 are the standard deviation and the variance respectively.
The merits of Average filter are given below:
III. PROPOSED ALGORITHM FOR NOISE REMOVAL
In OCR systems, presence of noise can reduce the recognition rate of document images [45]. Therefore, pre-processing of the document images is necessary for inconsistent noisy document images. The initial phase in the pre-processing is the conversion of the grey image to the binary image using Otsu’s method [40] and then the filtering process is employed to clear the noise from the image [43]. This paper describes at a technique to mitigate the random noise the document images in the following phases:
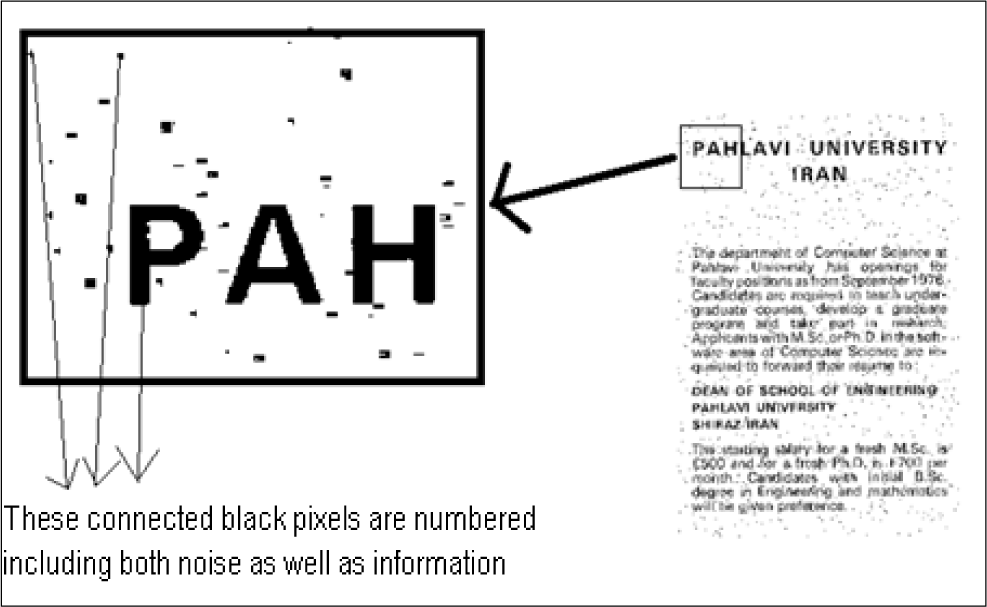
Step 1: First, the algorithm reads whole text image in the top-down manner traverse each column of every row from left to right pixel by pixel so that all the connected black pixels areas are identified and are numbered these areas include both types of area which denote noise as well as character/information. For numbering of connected black pixels, the concept of flood fill is used. As the whole image is treated as array of integers which have values from 0−255 in grey scale and 0 or 1 in case of binary image. Due to these restrictions the concept of flood fill cannot be directly applied to image as the number of black areas would be then restricted to the range 0−255 i.e., only 256 separate regions can be numbered in case of grey scale image and only two in case of binary image. To cope with this, we work on the image treating it as the pure integral array which does not have to be concerned with intensity levels. In this way, we can number as much area as in image starting from the 1 without any restrictions as shown in Fig. 1. Thus, we get the virtual identity of each region.
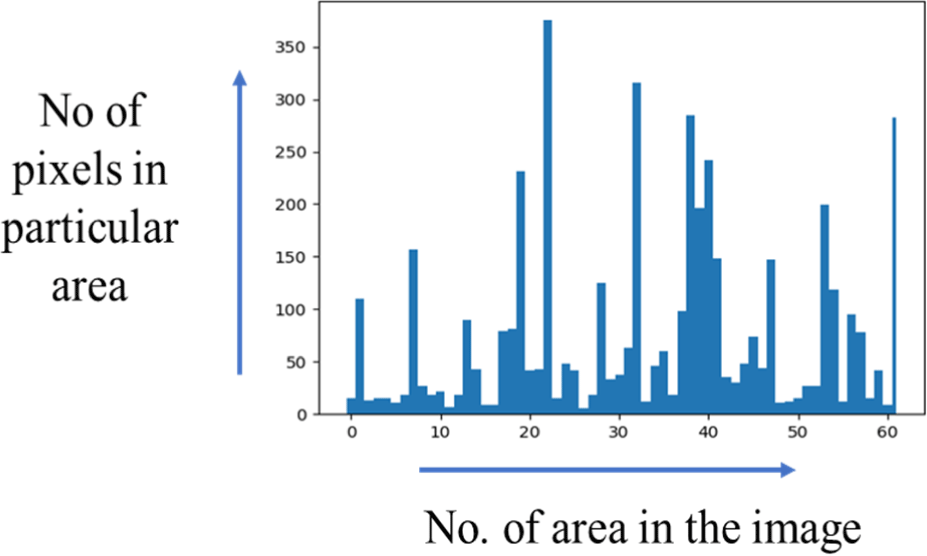
Step 2: Here the determination the quantity of black pixels (BP) in each numbered region is carried out. The regions having lesser quantity of black pixels are noise and larger numbers of BP denote information. At this level, there are two types of data, one is the number of black regions in the image and the other is number of BP in each region. This is represented graphically in Fig. 2.
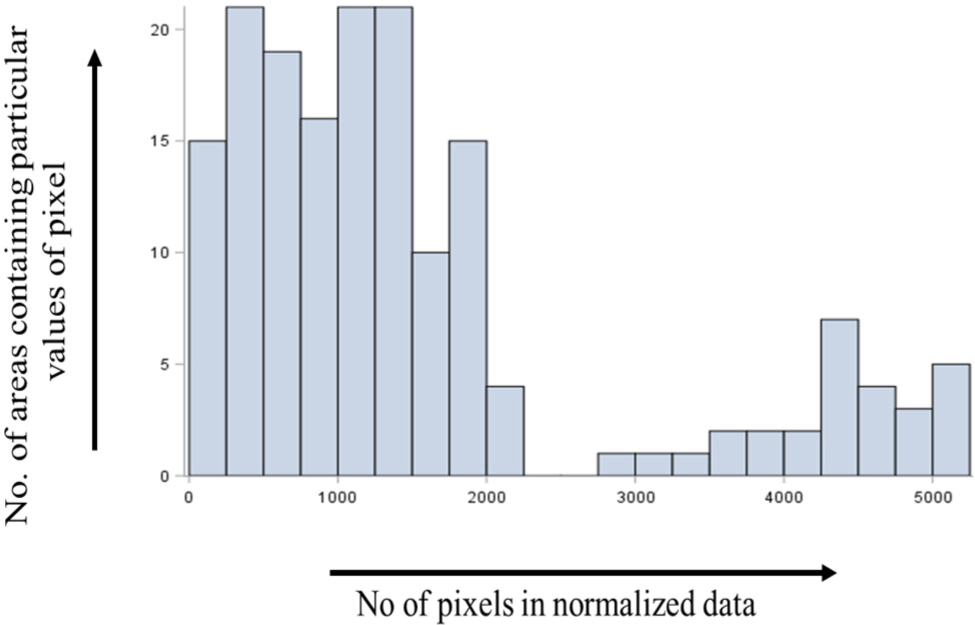
Step 3: The data thus obtained can have several maximum values of the BP in any black region i.e., number of BP can be in the range 0 to N, where N can take any integer value so it would make the processing difficult as this range is different for different images thus, we normalized the data to the range of 5000. From the experiments, it is observed that as the range of normalization is increased the effectiveness of the method increases. Thus, we used the normalization range of 5000. The advantage of using such a large value is that the information about any of the regions that is the number of black pixels within it is lost in minimum scale in comparison if we use small value such as 100, 200 or 255.
The following formulas are used for the Normalization of the data:
where, Max. Value is the number of BP in a region which contain maximum of BP among all regions; Min. value is the number of BP in a region which contain minimum of BP among all regions. X is the Value to which data is normalized, we used X=5000.
Step 4: After the normalization, we had data representing area having pixels in the range of 1−5000. Now, we determine the number of areas corresponding to each value of pixels i.e., 1−5000 from the normalized data say DAT1 shown graphically as in Fig. 3. Black background is used to make small values of data visible by indication them with white in Fig. 3.
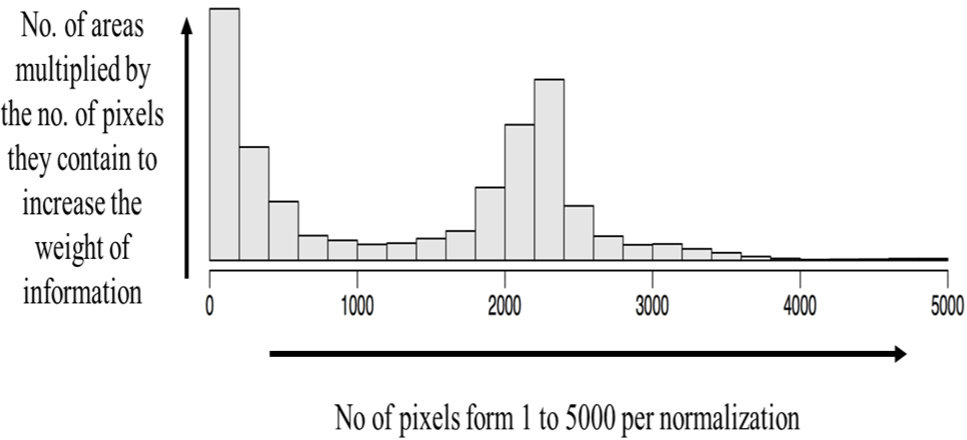
Now we must calculate/ determine the number of BP say NP for which all the region having number of BP less than NP are considered noise and above it as information. To determine NP for the image we had to determine NP first for the normalized data and then convert it back to the range from which it has been normalized. Since we aim to remove the regions which represent noise, the noise regions are generally lies at the lower side of DAT1 i.e., area having lower values of number of pixels. We must increase the weight of information (so that they become comparable to noise which has large number of small areas) while determining NP for this we multiply number of areas in DAT1 with number of pixels they contain. In this manner the number of areas containing 1 pixel get multiplied by 1, area containing 2 pixels is multiplied by 2 and so on thus the area having higher number of pixels is multiplied by higher values thus information being the area having good number of pixels get multiplied by large values thus their weight is increased, and they can be compared with large number of noisy areas. Multiplication as described previously results into data DAT2 (Shown in Fig. 4) which had increased weightage of area having higher number of pixels in comparison to DAT1. After forming the DAT2 we need to calculate the value of NP for this purpose we maximize the between class variance of the represented graphical data as shown graphically in Fig. 5. The value of the number of pixels which had maximum between class variance is considered as our required NP. Between class variance is calculated for each of the number of pixels i.e., is from 1 to 5000 and number of pixels for which between classes variance has maximum values is considered as NP.
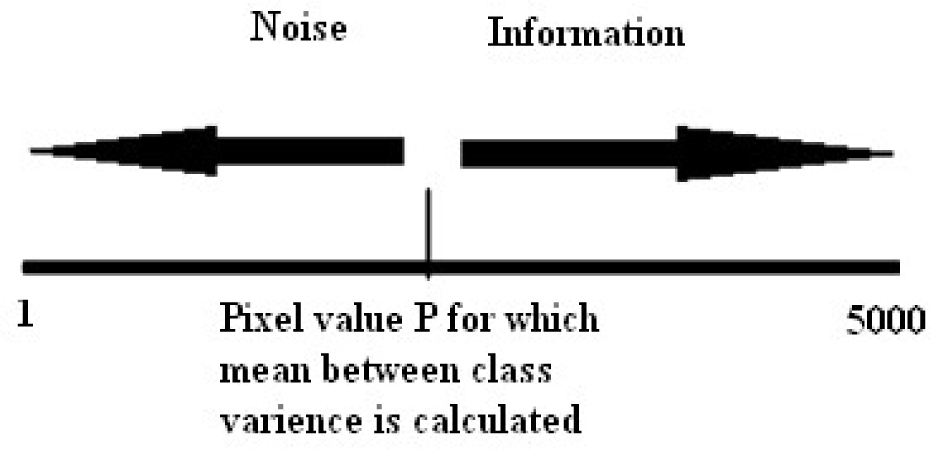
While determining between class variance for the pixel values say P, we assume that pixel’s value below this value is noise and above this is information
Weight (W) corresponding to pixel P is calculated using equation (4):
Two weights are calculated, one is for pixels for noise i.e., is W1 (pixels below p) and other is W2 for information.
Mean of the values is calculated using the following formula:
Here the variable x represents the number of pixels whreas P(x) shows the weight pf pixels. Two values of mean of the number of pixels represnting noise M1 and mean of the number of pixels representing information M2 are calculated one for pixels values below P and one for above P.
Here, two types of variance is calculated V1 for noise and V2 for information. Calculation of variance can be done according to equation (6):
where Pi = P(x) of intensity i.
Within Class variance is obtained with the help of the following formula:
Between Class Variance is obtained with the help of the following formula:
The Between Class Varience is calculated for the pixels value 1−5000 and the value for which it is maximum is taken as NP. Now this calculated NP is needed to transformed back to its range from the normalized form so that it can be used to process noisy image. The value of NP obtained after this is the number of black pixels that must be present in any area if it is to be information.
For the removal of noise we take a white portion image of same resolution and copy that areas which had value equal to or more than NP address by address from noisy image to new image. In this manner the newly obtained image will be free from the noise.
Step 5: steps 1 to 4 are iterated six times for better removal of noise.
IV. GROUND TRUTH BASED MEASURES
The performance analysis of the suggested method for noise removal is presented using PSNR, NRM and F-measure. These are briefly summarized as following:
It is the ratio of the maximum power of a signal and noise power that affects the fidelity of its representation.
where
Here original image is represented by I and I` is binarized version of the image
V. EXPERIMENTAL RESULTS AND DISCUSSIONS
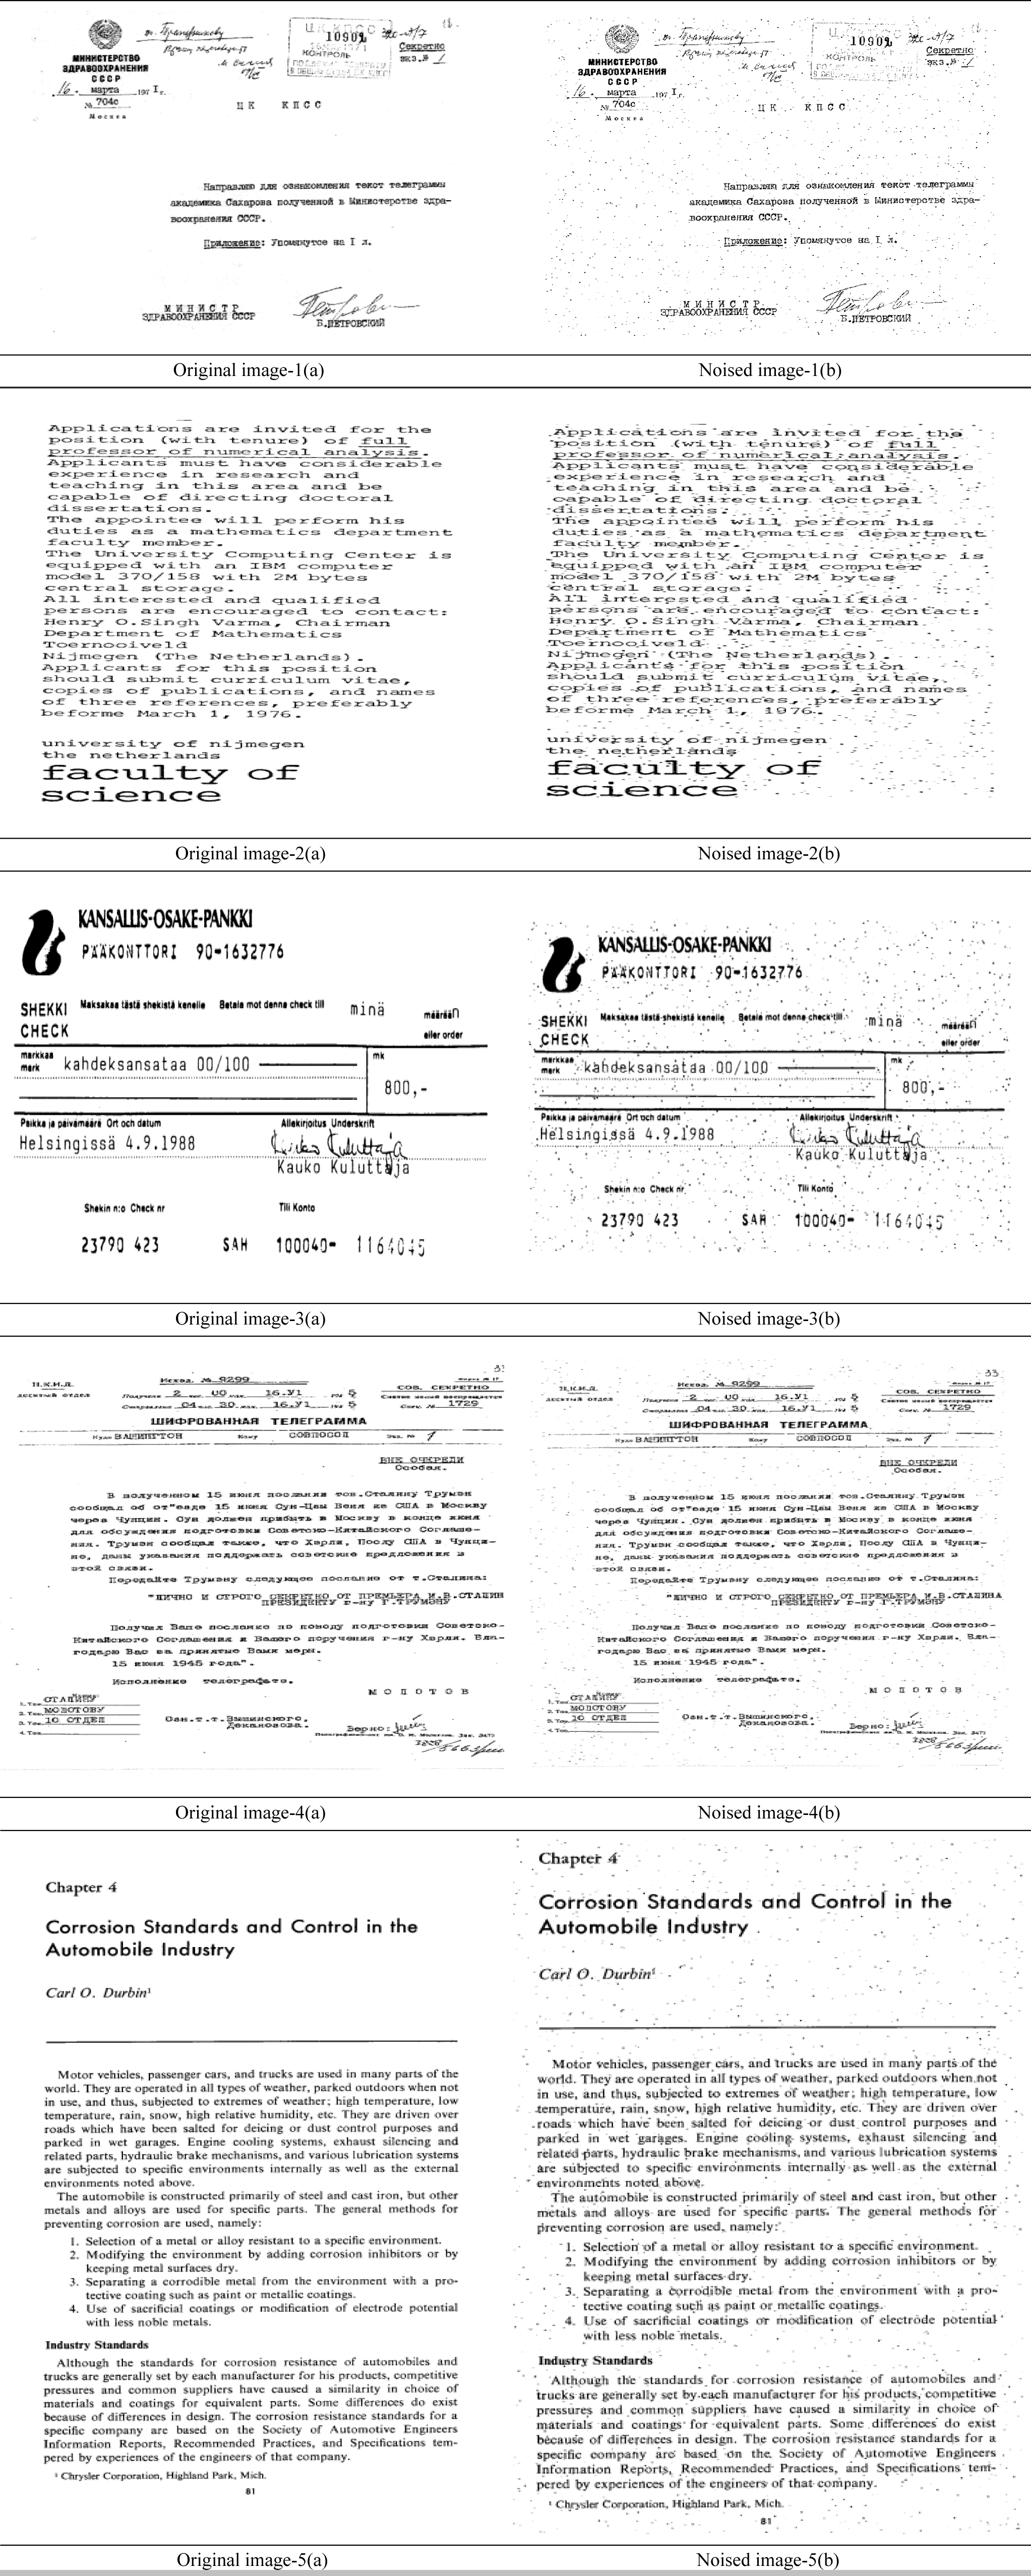
For experimentation, a dataset of handwritten as well as printed Devanagari and English documents were collected (sample images are shown in Fig. 6) from books, offices, newspapers and artificial generated by computer. Two types of high-quality real-life scanned document images viz noise free and noised. In clean image, some random noise is introduced using C++ library function and the results for clean and cleaned image after denoising can be compared on the parameters explained in section 4. The average and Weiner filtering are done using grey images then results are binarized to calculate the evaluation measures.
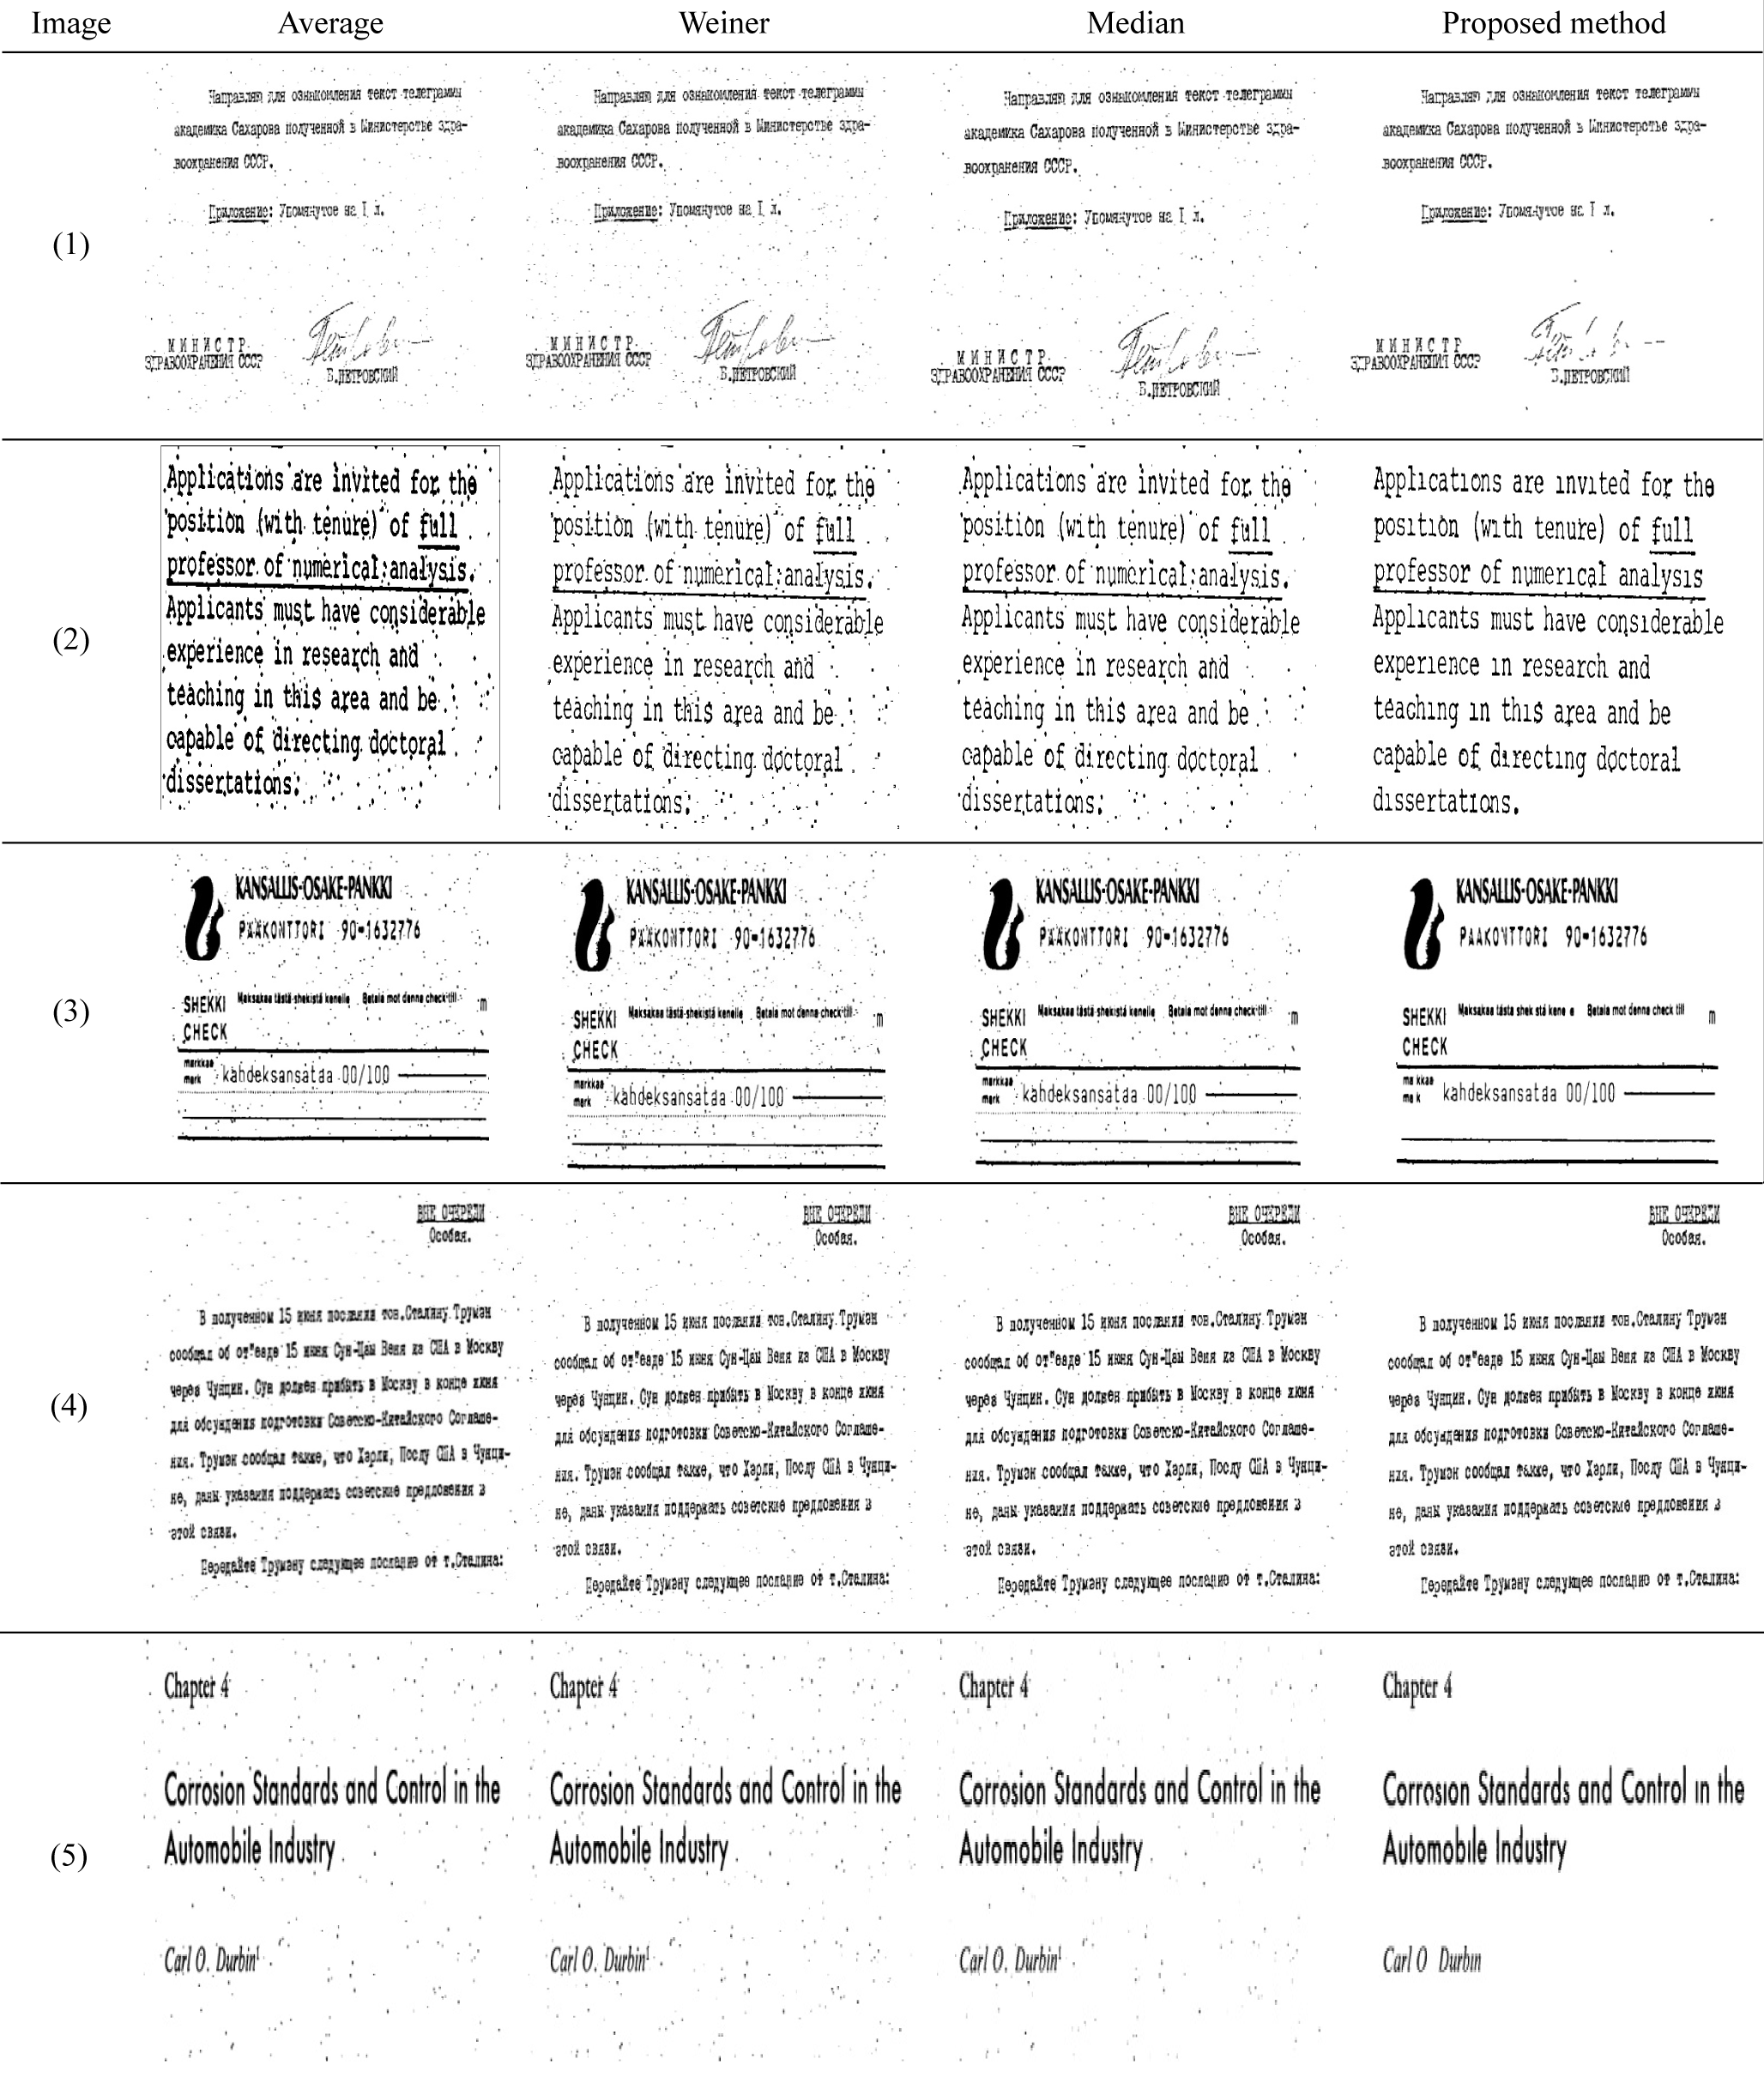
Based on results of image1 of Table 1, the PSNR of proposed method (22.77 dB) is higher than average filter (18.36 dB), Weiner filter (14.89 dB) and median filter (18.26 dB). The F-measure of proposed method is 82.3644% which is greater than average filter (81.473%), Weiner filter (32.154%) and median filter (79.5219%). The proposed method has lower NRM (1.09061) with comparison to average filter (7.15771), Weiner filter (4.31239) and median filter (6.40972).
Results of image 2 of Table 1 shows that PSNR of proposed method (22.46 dB) is higher than average filter (12.18 dB), Weiner filter (11.46 dB) and median filter (18.62 dB). The F-measure of proposed method is 96.2263% which is greater than average filter (73.7318%), Weiner filter (60.309%) and median filter (92.0617%). The proposed method has lower NRM (1.40903) with comparison to average filter (20.787), Weiner filter (6.94014) and median filter (5.01784).
Results of image 3 of Table 1 dictates that PSNR of proposed method (23.79 dB) is higher than average filter (19.12 dB), Weiner filter (14.49 dB) and median filter (20.27 dB). The F-measure of proposed method is 96.7298%which is greater than average filter (92.049%), Weiner filter (67.4895%) and median filter (93.5766%). The proposed method has lower NRM (0.792766) with comparison to average filter (7.0705), Weiner filter (3.00505) and median filter (4.14711).
Results of images 4 and 5 shown in Table 1 are also promising as compared to average, Weiner, median filters. Hence, the experimental results and comparison with average, Weiner and median filters proved the accuracy of the proposed technique on the noised document images.
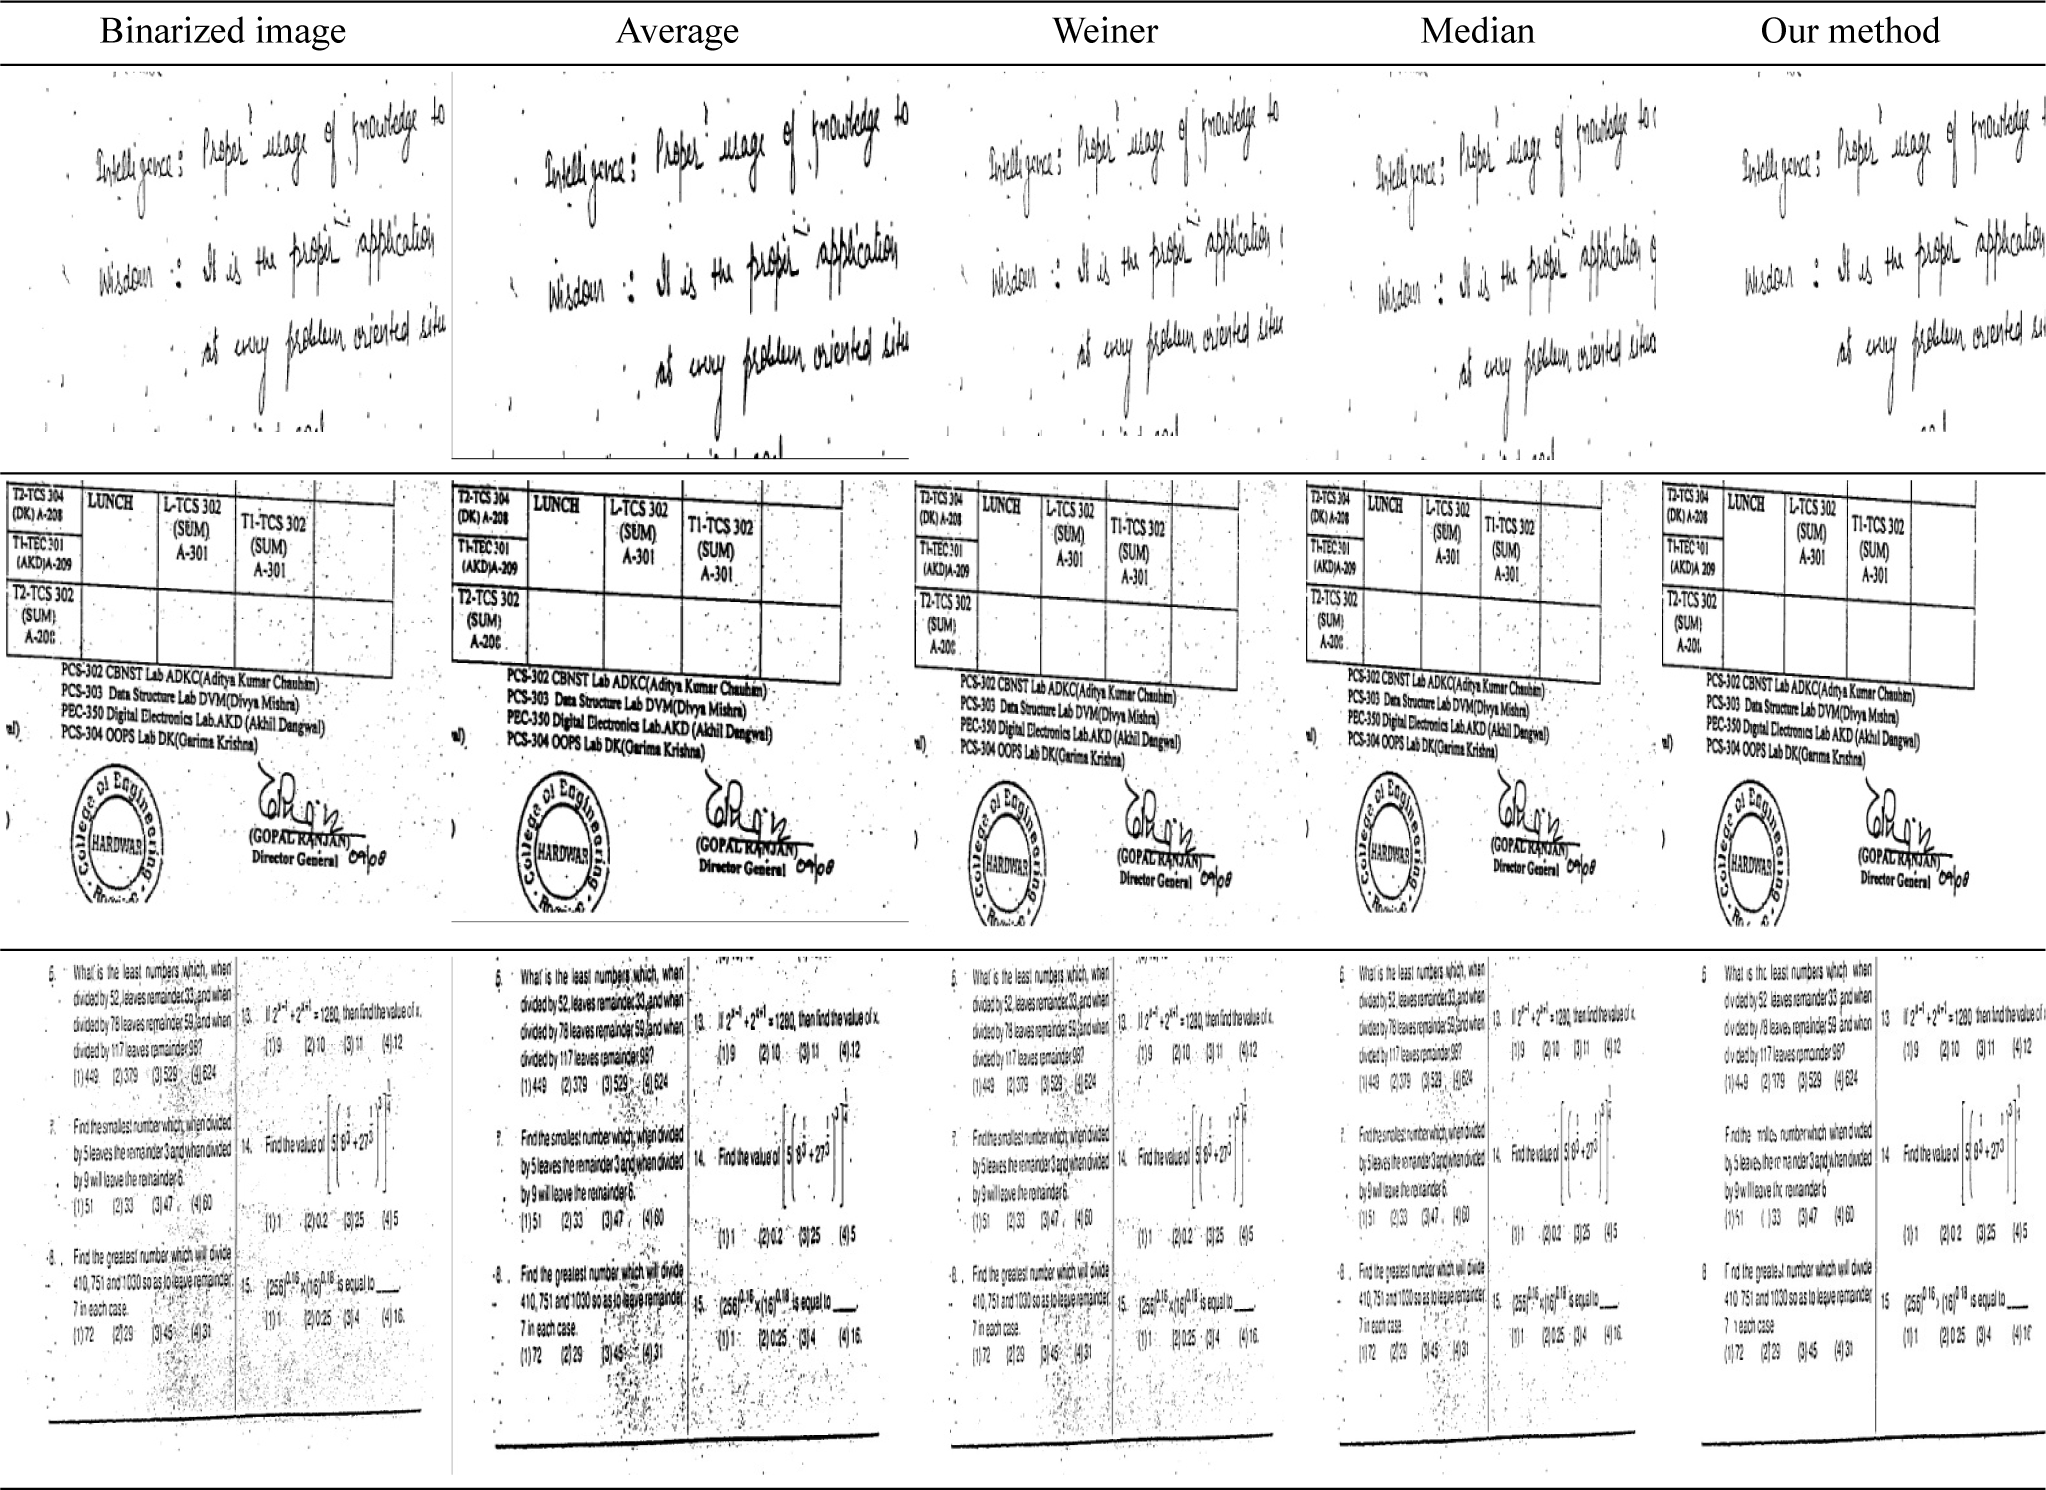
Fig. 6 shows the noise free (ground truth images) and noised document image samples. Fig. 7 shows the comparison results of noised document images of average, Weiner, median filters, and proposed method. Fig. 8 shows the results of average, Weiner, median filters, and proposed method.
VI. CONCLUSION
To share or preserve information, operations like printing, photocopying, and scanning are necessary. These operations add noise in the document iamge and degarde the quality of the image. In present work, a novel approach is disscussed by the authors for cleaning the noise from the real life document images. The clean image and the processed image have been taken for and on the basis of three evaluation measures: PSNR, F-measure, NRM, and comparision with results of average filter, Weiner filter, and median filter, proposed method of noise removal is observed promising.