I. INTRODUCTION
In communication studies, the communication affect usually refers to the changes in cognition, emotion, attitude, and behavior of the audience after receiving information. The measurement methods of communication effect are mainly divided into three forms: verbal, physiological, and psychological, and behavior.
The main goals of media emotional messaging are attarcting, attention, entertaining, and persuading [1]. Media messages contain content explicitly designed to evoke emotions such as fear, anger, joy, and sadness. Emotion is an important aspect of journalism and communication. Agenda setters convey positive, negative, or neutral emotions to the public by endowing different content with different emotional colors, and ultimately affect public perception [2-3]. Researchers have analyzed award-winning journalism works and found that journalists used emotion as a strategy to embed in media practice [4].
The term “post-truth” was selected into the Oxford Dictionary in November 2016. In the “post-truth” context, emotional expression plays an important role in the audience's perception of objective facts. Emotional content can affect public opinion more than objective facts. However, “post-truth” does not mean the denial of the truth, but the recognition of the influence of factors other than the facts on the truth. Scholars use the “third reality” to describe the “post-truth” era and believe that “post-truth” is the information content between objective reality and fiction, that is, “emotional reality”. Emotional expression is an important characteristic of media information content in the “post-truth” era. The “post-truth” era’s characteristics of emphasizing emotion and ignoring facts have further intensified the emotional catharsis of social media users.
In social media, there is a phenomenon of emotional contagion, in which users transmit emotions during inter-action, and eventually catalyze emotion homophily within a certain range [5]. As a dependent variable to measure the effect of communication, emotion has been focused on. Communication studies take a distinct emotional turn [6-7]. Chung and Zeng (2020) found that specific emotion categories (anger, fear) contributed significantly to gene-rating inter-user influence. Emotion appears to play a more important role in facilitating information dissemination [8].
II. THE THEORETICAL FRAMEWORK
Emotion originally referred to moving from one place to move outward to another place [9]. Different emotions are associated with different thoughts. The research on e-motion has received great attention and spread to related fields such as sociology, anthropology, communication, and cultural studies [10]. Studying the role of emotion inmass media has become an important topic in the emerter (2001) defined emotional content as verbal, nonverbal, and preverbal emotional language [12]. Emotional media messages are those in which people feel emotion [13].
For emotional representation, many researchers have proposed corresponding emotional representation methods, mainly in the following categories. Classifying and expressing emotions is called discrete model theory. This theory holds that complex emotions are composed of basic emotions. Representing emotions from a dimensional perspective is called continuous model theory. This theory maps emotions to the V-A-D three-dimensional model of emotional valence. some studies call it pleasure, arousal, and dominance and use multidimensional continuous variables to represent emotions. The representation method of the continuous model can vectorize emotions and has good scalability. This model has increasingly dominated affective computing in recent years.
The emotional dimension model considers that the differences between emotions are continuous, and each emotion can be mapped to a specific location in the multidimensional emotional space. The dimension theory is that emotions are mapped into the valence, arousal, and dominance dimensions [14].
Russell (1980) proposed a circumplex model of emotions, suggesting that emotions can be characterized by their arousal (intensity) and valence (positive or negative) dimensions. Russell (1980) divided emotions into two dimensions: one is valence, from positive to negative, indicating that emotions change from pleasant to unpleasant; the other is arousal, from weak to strong, indicating from calm to excited. Arousal refers to the intensity of response to stimuli. Valence (or “evaluation”) reflects the degree to which experience is pleasant or unpleasant. Each emotion can be understood as a linear combination of these two dimensions, or as varying degrees of both valence and arousal [15].
The discrete emotion model contains a variety of main emotions, including positive and negative emotions. In the discrete model, the emotional space is composed of discrete and limited basic emotions. The discrete emotion model assumes that emotions are represented as discrete categories, while complex emotions are a combination of multiple basic emotions. Izard (1993) defined emotions as discrete, specifying distinctions between interest, joy, surprise, sorrow, anger, disgust, contempt, fear, shame, and guilt. Ekman and Friesen (1971) proposed that there are six basic emotional expressions, which are anger, disgust, fear, happiness, sadness, and surprise [16].
Visual attention can be considered from the perspective of distributed brain activity engendered by visual input. Eye movements are the result of the interaction between cognitive and perceptual processes, and they can be a powerful way to investigate psychological processes such as language processing, image processing, auditory processing, memory, social cognition, and decision making unobtrusively and accurately. Visual behavior in general can be characterized by fixations (where one’s eye stops to consider some phenomenon in a field of vision).
Psychological research shows that eye movement is associated with psychological changes, and visual behavior can reflect people’s preferences for viewing objects. Eye-tracking technology is physiological response measurement technique to analyze the users’ psychological responses and cognition. Attention was measured as visual attention using eye tracking. Attention is linked to visual fixation, and visual fixation is linked to cognitive processing. Eye-tracking methods assume that there is a direct link between where one looks and what one cognitively attends. The laboratory experiment also allows scholars to use the eye-tracking technique to unobtrusively record one’s attention to a certain area of the stimuli. The eye-tracking method can record the gazing process and brow-sing tendency of people when observing screen information and abstract the mechanism of adding information to the human brain. Eye-tracking is being used to assess cognitive attention resource allocation. Eye-tracking methods can measure the direct link between where one looks and what one cognitively attends. According to the previous description of eye tracking metrics, fixation duration, and fixation count will be selected as measures reflecting visual attention in this study. For measuring the subjects' visual cognitive responses, parameters fixation duration and fixation count will be recorded in conjunction with the AOI tool through Eye tracking.
Human cognitive resources are limited, and individuals cannot process all the information [17-18]. According to selective attention theory, the emotional information attracts more attention than non-emotional information [19]. The eye-tracking method can record the gazing process and browsing tendency of people when observing screen information and abstract the mechanism of adding information to the human brain. Eye-tracking is being used to assess cognitive attention resource allocation. The eye-tracking technique has been demonstrated as a reliable and validated way of measuring attention to social media content [20]. Attention is linked to visual fixation [21], and visual fixation is linked to cognitive processing [22]. Based on the eye-mind assumption, using visual attention to measure a direct link between where one looks and what one cognitively attends [23].
III. RESEARCH QUESTIONS AND METHOD
The fixation can reflect one’s depth of processing [24-25]. The more time person spends on a certain post, the more attention it attracts. We hypothesize that emotions draw more attention than non-emotional content. Based on these studies, the study formulated the following hypothesis:
H1: Contents with emotional tone receive more fixation times and fixation counts than contents without emotional tone.
H2: Contents with a negative emotional tone receive more fixation times and fixation counts than contents with a positive emotional tone.
H3: The more emotional and negative contents would draw more visual attention than their opposed contents (non-emotional, positive).
Q1: The fixation times and fixation count of different emotions are different on different platforms.
To test preregistered hypotheses, we relied on an experimental eye-tracking design. The participants were 40 students recruited via advertising.
King et al. (2019), who collected all studies using eye tracking published in 25 major communication science journals between 2005 and 2015, showed that the average study relied on 82 participants (min=10, max=248) [23]. The number of people in this study depended on the resources of the laboratory and the availability of participants during our study. We preregistered the following exclusion criteria: insufficient data quality, eye problems, unexpected distractions that occurred during the experiment, attention deficit disorder, or dyslexia.
This study chooses TikTok and Twitter as the research objects. First, the selection of research objects is relatively open and not limited to a certain nationality. Both TikTok and Twitter have global influence and user bases, becoming important social media platforms for people to share opinions, create content, interact with others, and obtain information. TikTok and Twitter are social media with many users worldwide and can be chosen as social media platforms for this study. Second, the research purpose of t-his study is to explore users' perceptions of emotional content on different types of social media platforms. TikTok is a video-sharing application that allows users to create and share short-form videos, instead, Twitter is the platform where users broadcast short text posts. As different types of social media platforms, choosing TikTok and Twitter can further analyze whether users have different perceptions of emotional content on different social media platforms. TikTok and Twitter are consistent with the rese-arch purpose of this study and the characteristics of the research object and provide suitable mechanisms for displaying and disseminating emotional content.
Both groups were exposed to the same stimuli content, only the platform is different. The stimuli were news from BBC about the US-China trade war, then presented in the layout of simulated Twitter and TikTok APP. Each platform contained nine manipulated news: a human account (one positive, one negative, and one neutral) X social media bot account (one positive, one negative, and one Neutral) X new agent (BBC-positive, CNN-negative, People daily-neutral). Participants view content one by one on the desktop screen.
The content of the stimulus material was artificially developed and included neutral, positive, and negative tones. Neutral content means that it does not involve an emotional evaluation of the article, while negative content and positive content include negative evaluation and positive emotional evaluation respectively [26-28]. Based on these concepts, the stimuli were manipulated in three steps. First, we selected news from the BBC about China-US trade reports. Each news report was classified by para-graph, according to the emotional tone (positive, negative, and neutral) of the content. Based on not changing the meaning of the original text of the news report, some words were deleted to make the length suitable for Twitter and TikTok platforms. Second, in order to match the form-at of Twitter and TikTok (text+picture, text+video), all images are from each news report on the BBC News website, and the picture is generally a relatively objective statistical data picture. In the third step, this research will imitate Twitter and TikTok APP, and place the same content on two apps respectively. To achieve the best experimental effect, the length of all nine messages was 37 words. In the TikTok and Twitter layouts, the font size, paragraph spacing, and position of the message, as well as the size and position of the picture, are all consistent. Each content has the same number of words. Therefore, our selected stimuli are comparable and will not affect the validity of the experiment.
This study conducted an online questionnaire in which 20 participants (20 participants who did not participate in subsequent eye-tracking studies) rated 36 manipulated items on the bipolar axis according to emotional arousal (from 1, “not emotional at all,” to 7, “very emotional”), valence (from 1, “very negative,” to 7, “very positive”). According to the score, the content with the highest score of neutral (N=3), positive (N=3), and negative (N=3) was selected as the stimulus material of this study. We repeated the manipulation check in the actual study, and it remained an overall fit with how people experienced the contents.
The whole experiment consists of three stages: the experimental pre-test stage, the experimental subject stage, and the experimental follow-up stage. Participants took part in the study at the Digital Media Research Laboratory at Kyungsung University in Busan, South Korea. All were screened to ensure normal or corrected-to-normal vision.
According to the previous description of eye tracking metrics, fixation time and fixation count will be selected as measures reflecting visual attention in this study. Areas of interest (AOI) are selected regions of a displayed stimulus. In this study, each stimulus contained one AOI, that is, text content on TikTok and Twitter. 40 participants were divided into two TikTok and Twitter. Each platform was randomly assigned 20 participants. Before reading the 9 posts on social media, all participants were told that they would read 9 posts on TikTok/Twitter about the US-China trade war. Among the 9 contents, 3 were posted by human accounts, 3 were posted by robot accounts, and 3 were posted by news agencies. The 9 stimulus materials were randomly arranged, that is, the sequence of stimulus materials seen by each subject was in consistent. The eye-tracking study was conducted using the Tob-iiT60XL eye tracker. The device looked like an ordinary 24-inch computer monitor and did not disturb participants with anything uncommon to a usual Internet session, such as visible cameras or head-mounted devices. Following Kohout et al. (2022), a study was conducted a test to test the intended emotional tone. In the questionnaire, participants rated manipulating users' emotional content based on emotional arousal (on a scale of 1, "no emotion at all", to 7, "very emotional") and titer (on a scale of 1, "very negative", to 7, "very positive").
IV. RESULTS
This study conducts an attention check on the participants in the formal experiment. If the participants have problems such as high myopia, astigmatism, amblyopia, left-right imbalance, or other visual prosperous data defects, they will be excluded.
A total of 40 subjects participated in the experiment. There are 18 males and 22 females. The age distribution of participants was 18–25 years old (17), 26–30 (19), and 31–40 (4). The distribution of academic qualifications is as follows: bachelor’s degree (2), master’s degree (28), and Doctorate (4). In this study, we also collected several other variables. These variables include use frequency, interest in the Topic, interest in politics, and credibility on the platform (Table 1).
The results of emotional arousal value experienced by the participants, emotion (Mean=5.3000, SD=.33589) is significantly higher (t=14.082, p=0.000) than non-emotion (Mean=4.0917, SD=.38481). Positive (Mean=5.1583, SD=.40641) and negative (Mean=5.4417, SD=.59623) is significantly higher than neutral (Mean=4.0917, SD=.38481). The negative values (Mean=5.4417, SD=.59623) are slightly higher than the positive values (Mean=5.1583, SD=.40641), but the difference is not significant.
Fig. 1 and Fig. 2 showed the distribution of participants' attention while browsing Twitter and TikTok platforms. Heat maps are data visualizations that can communicate important aspects of visual behavior clearly and with great power. Heat maps show how looking is distributed over the stimulus. Red is the maximum value in the heat map. Red indicates the highest level of fixation, followed by yellow and green. Areas with no color receive no fixation. Red, yellow, and green colors in descending order indicate the duration of the gaze pointing to the part of the image.
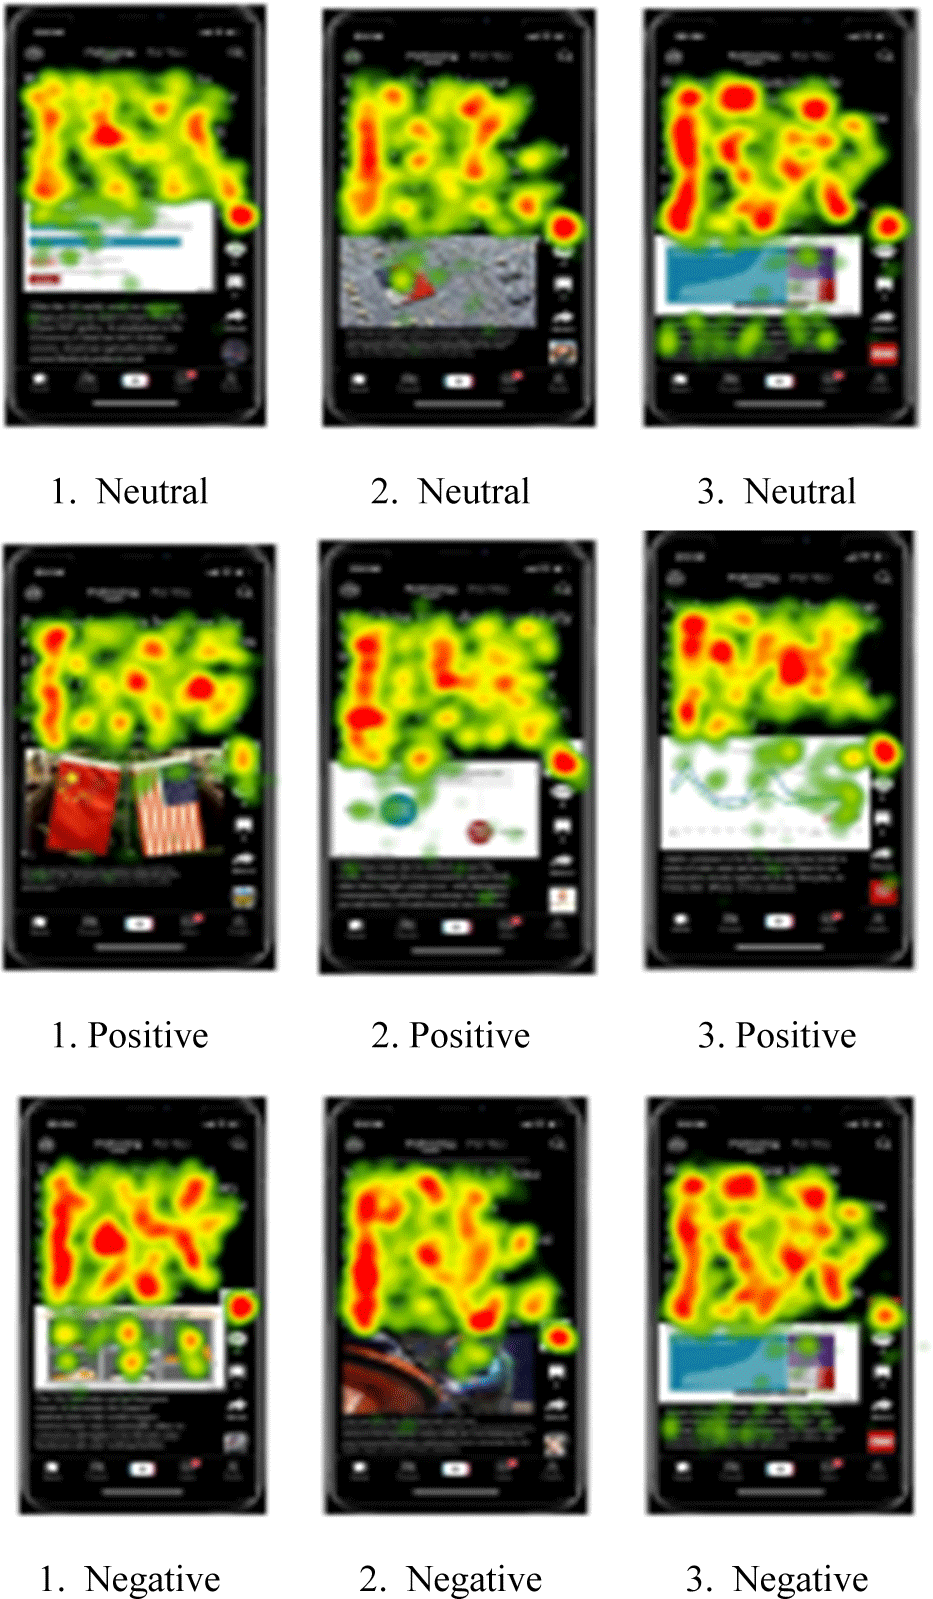
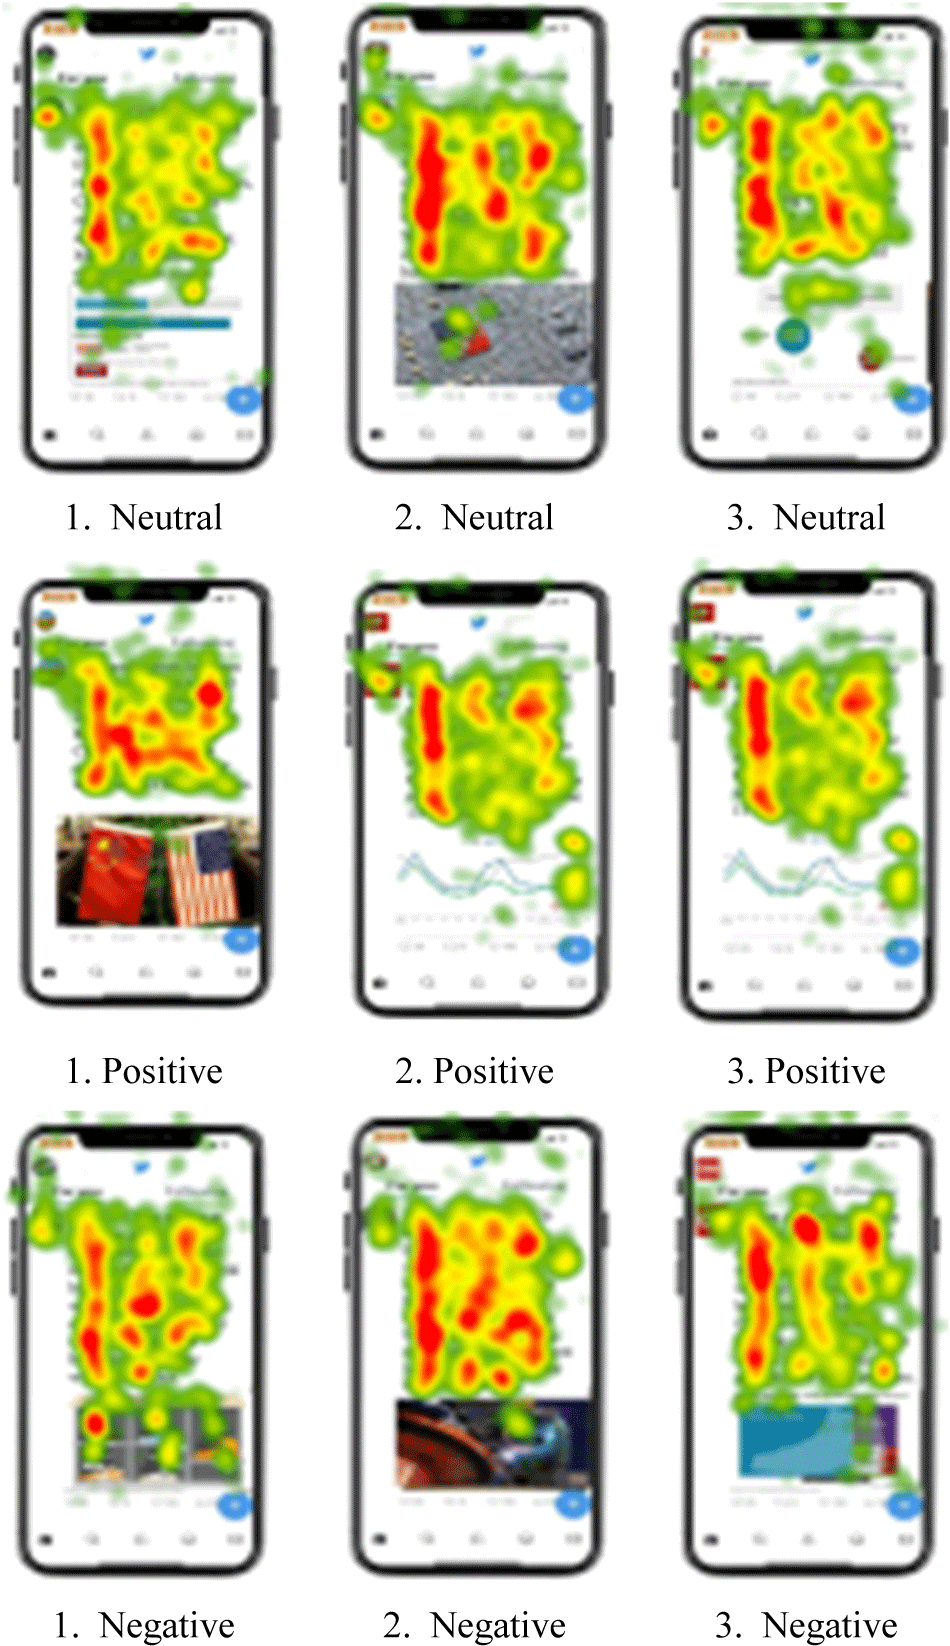
More eye gazes on the AOI imply how important it is to the participant, which means that the image attracted the attention of the participant. In the study, a heat map was used to easily identify the frequency of gazes and durations of participants (Fig.1, Fig. 2).
The paired T-test was further used to analyze the differences in fixation time and fixation count between emotional and non-emotional texts, negative and neutral texts, positive and neutral texts, and positive and negative texts. Turning to the reading time of the texts, in Table 2, we found that participants spent relatively more time reading the emotional (M=13.6840, SD=3.60731) than non-emotional (M=13.4253, SD=3.67391), but the difference was not significant. Participants spent relatively less time reading the positive (M=12.2283, SD=3.18113) than neutral (M=13.4253, SD=3.67391). This difference was significant (t=−3.329, p<0.05) and indicated that people focused more on the neutral than the positive when they were required to be selective about which information received attention. Participants spent relatively more time reading the negative (M=15.1397, SD=4.48977) than neutral (M=13.4253, SD=3.67391). This difference was significant (t=3.698, p<0.05) and indicated that people focused more on negative than neutral when they were required to be selective about which information received their attention. Participants spent relatively more reading the negative (M=15.1397, SD=4.48977) than the positive (M=12.2283, SD=3.18113). This difference was significant (t=−6.314, p<0.05) and indicated that people focused more on the negative than the positive when they were required to be selective about which information received their attention.
Turning to the reading count of the texts, in Table 2, we found that participants spent the similar number of times reading the emotional (M=42.2917, SD=9.26807) and non-emotional (M=42.3750, SD=7.98795). Participants spent relatively more counts reading the negative (M=46.7000, SD=11.19366) than neutral (M=42.3750, SD=7.98795) and positive (M=37.8833, SD=18.33882). This difference was significant (t=3.232, t=−8.214; p<0.05) and indicated that people focused more on the negative than the neutral when they were required to be selective about which information received their attention.
Concerning H1, our results showed no significant differences between fixation time or fixation count on emotional compared to non-emotional. This result implied that there was no significant difference between the fixation time and fixation count when reading emotional content (positive and negative content) and non-emotional content (neutral content). However, our results showed there were significant differences between fixation time or fixation count on positive compared to neutral. There were significant differences between fixation time or fixation count on neutral compared to negative. Thus, our data partially support hypothesis H1.
Based on the analysis of fixation time and count, contents with a negative emotional tone receive more fixation times and fixation counts than contents with a positive emotional tone. Thus, our data support hypothesis H2. Current research shows that emotion related information takes priority in people's attention [29]. Eye movement is affected by text information containing emotional valence [30-31].
In this study, One-way ANOVA analysis was used to further investigate the differences in fixation time and fixation count between emotional text and non-emotional text, positive text, negative text, and neutral text when participants read AOI_Text on different social media platforms. As can be seen from Table 3, when participants read content on Twitter and TikTok, there was no significant difference between the two platforms in terms of emotional text, non-emotional text, positive text, negative text, and neutral text. The descriptive results suggested that the relationship between emotional and cognitive attention has little to do with social platforms.
In order to answer H3, regression analysis was used to analyze the effects of arousal and valence on fixation time and count. In this study, a total of 9 fixation times and fixation counts were collected for each participant in response to 9 stimuli on Twitter or TikTok. Concerning arousal, our results showed no significant differences between (a) fixation times (Table 4, Model 1) or (b) fixation counts (Table 4, Model 2) on emotional contents compared to non-emotional contents. This result implied that arousal did not influence visual attention.
Regarding the impact of valence on attention (a), we found a positive and significant effect for the negative valence (b=3.15, p<.01; b=9.03, p<.01). This result indicated longer fixation times on the negative content compared to the positive content. In other words, when people were more likely to read the negative content than the positive one. Therefore, our results partially supported H3, and thus indicated negativity bias for attention.
V. CONCLUSION AND DISCUSSION
Eye-tracking technology has proven to be a reliable and effective way of measuring attention to social media content. Eye tracking was used to assess cognitive resource allocation. Regarding fixation time, participants focused on negative text for the longest time, followed by positive and neutral. From descriptive statistics of fixation time and fixation count, we could see that 40 participants had longer fixation Times and fixation counts on AOI_Text. Participants spent relatively more time reading the emotional than non-emotional and spent relatively more time reading the negative than neutral and positive. Turning to the reading count of texts, we found that participants spent similar number of times reading emotional and non-emotional. Participants spent relatively more counts reading the negative than neutral and positive. This difference was significant and indicated that people focused more on negative information. Our findings show-ed that emotions grab attention and information processing differently. Our results showed that negative emotions attarcted more attention, which was consistent with previous studies on negativity bias, that is, negative information was more important [32-33] and attracted more attention [34].