I. INTRODUCTION
Skin cancer, as a major disease seriously threatening human health [1], its early detection and diagnosis play a decisive role [2]. In the medical field, early diagnosis of skin cancer can significantly improve the cure rate and survival quality [3]. There is a severe shortage of specialized dermatologists in many areas, especially those with relatively scarce medical resources [4]. A large number of skin cancer patients can not be diagnosed and treated early, and their conditions are accordingly delayed [5].
ISIC 2024-Skin Cancer Detection with 3D-TBP dataset [6] is a popular skin cancer dataset, which has heterogeneous data, namely structured data and unstructured data. Structured data include metadata and attribute values; while unstructured data are composed of the images. The metadata cover some important information, as shown in Table 1, including the data source, patients’ diagnostic information, symptom manifestations, etc. Data source helps researchers understand and analyze the differences between the data from different sources; the patients’ diagnostic information includes the patients’ past medical history; symptom manifestations provide a rich reference for comprehensively evaluating the patients’ conditions.
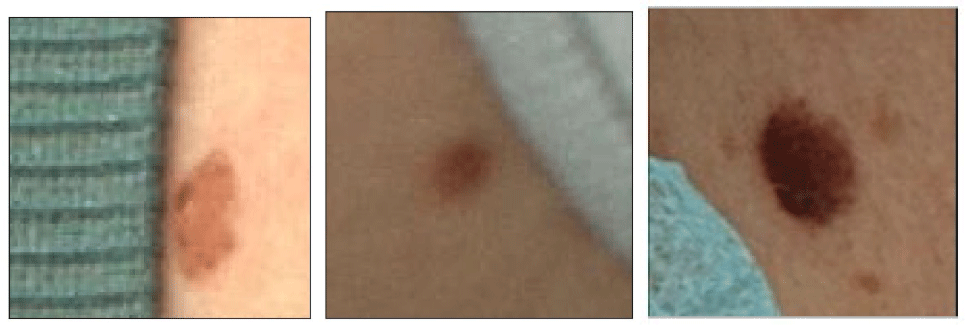
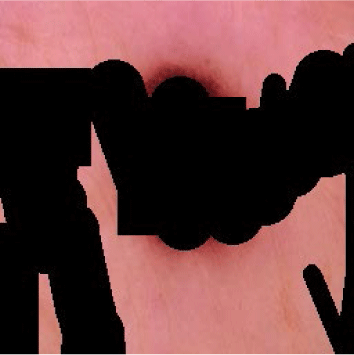
There are three challenges for the automatic diagnosis of skin cancer based on heterogeneous data. The first one is that the raw structured data cannot sufficiently employed. The second one is that many images are occluded, as shown in Fig. 1. The third one is that it is difficult fuse the heterogeneous data to achieve their complementary advantages. To address the two problems, the contributions of this paper can be summarized as follows.
-
(1) The structured data are mined and cleaned to generate more helpful data. 71 optimized attributes are constructed or selected for diagnosis by removing the useless attributes and the redundancy.
-
(2) Many images, as unstructured data, are occluded by the patients’ own hair, clothing, and jewelry, or due to shooting angle and distance. SelfClean [7] technique can accurately identify occluded images. Squeeze-and-Excitation Networks SIREN Mask-Aware Transformer (SS-MAT) is used to repair the occluded images, which is enhanced by attention mechanism and a neural network, so it is more suitable for the spatial continuity of skin cancer. Then deep learning models are used to extract the features from the repaired images.
-
(3) Finally the features extracted from structured data and unstructured data are inputted to three classifiers, namely LightGBM, CatBoost and XGBoost, which vote jointly to make the final decision.
The score of the model is improved from 0.1740 to 0.1935, which significantly improves the prediction accuracy of skin cancer.
II. RELATED WORKS
In the biomedical field, disease prediction faces many challenges [8], including the high complexity of the human physiological system, the diversity of disease triggers, and the significant differences between individuals. It requires not only processing huge amounts of biomedical data [9], but also accurately understanding the intrinsic laws of disease development.
In order to overcome these challenges, machine learning algorithms are commonly used and combined to build reliable models for disease prediction [10]. In diabetes prediction research, Choudhury et al. [11] attempted to apply machine learning to diabetes prediction in 2019. Yang et al. [12] proposed the StoolNet model for color classification of fecal medical images in 2019. In 2022, Leng et al. [13] proposed a lightweight practical framework for fecal detection and recognition. Ozsahin et al. [14] delved into the impact of feature scaling on machine learning models for diabetes diagnosis. In the same year, Ahmad et al. [15] conducted a comparative study on sequential feature selection for cardiac disease diagnosis. Jasti et al. [16] combined structured data with image data for breast cancer diagnosis. Ahsan et al. [17] systematically analyzed multiple machine learning algorithms for cardiac diagnosis and their problems. Liao et al. [18] designed a algorithm to diagnose human health through fecal images. Yang et al. [19] proposed multi-task lightweight network for health detection based on fecal images.
In order to overcome the occlusion, image repairing is a significant progress in recent years under the impetus of deep learning technology. In 2022, Suvorov et al. [20] proposed the LaMa model, which introduced a new type of repair network with a high sensory field perceptual loss function, and was able to efficiently deal with the complex image repair tasks, such as large-area deletion. In the same year, Li et al. [21] proposed the Mask-Aware Transformer (MAT) model, which realized the efficient repair of high-resolution images by fusing the advantages of the Transformer and convolutional neural network. In 2023, Jeevan et al. [22] proposed the WavePaint model based on the WaveMix fully convolutional architecture, which further improved the efficiency of image repair.
In 2024, the field of image repair has many breakthrough achievements. The BrushNet proposed by Ju et al. [23] adopted a dual branch structure, which significantly reduced the learning burden, and could flexibly embed pre-trained diffusion models. Corneanu et al. [24] proposed LatentPaint, which achieved excellent repair results by optimizing a small number of parameters and constructing a universal diffusion model. The DNNAM proposed by Chen et al. [25] Effectively solved the problem of insufficient multi-scale feature perception by utilizing some multi-scale channel attention mechanisms. The Spa-form model proposed by Huang et al. [26] utilized sparse self attention mechanism to significantly reduce computational complexity. The PowerPaint proposed by Zhuang et al. [27], as a multifunctional repair model, achieved multitasking processing through learnable task prompts, demonstrating strong versatility and improving repair performance.
Machine learning is effective for analyze structured data, so we use machine learning to extract features from structured data and deep learning to extract features from unstructured data. Because SS-MAT is advanced, we improve it to better diagnose skin disease.
III. METHODS
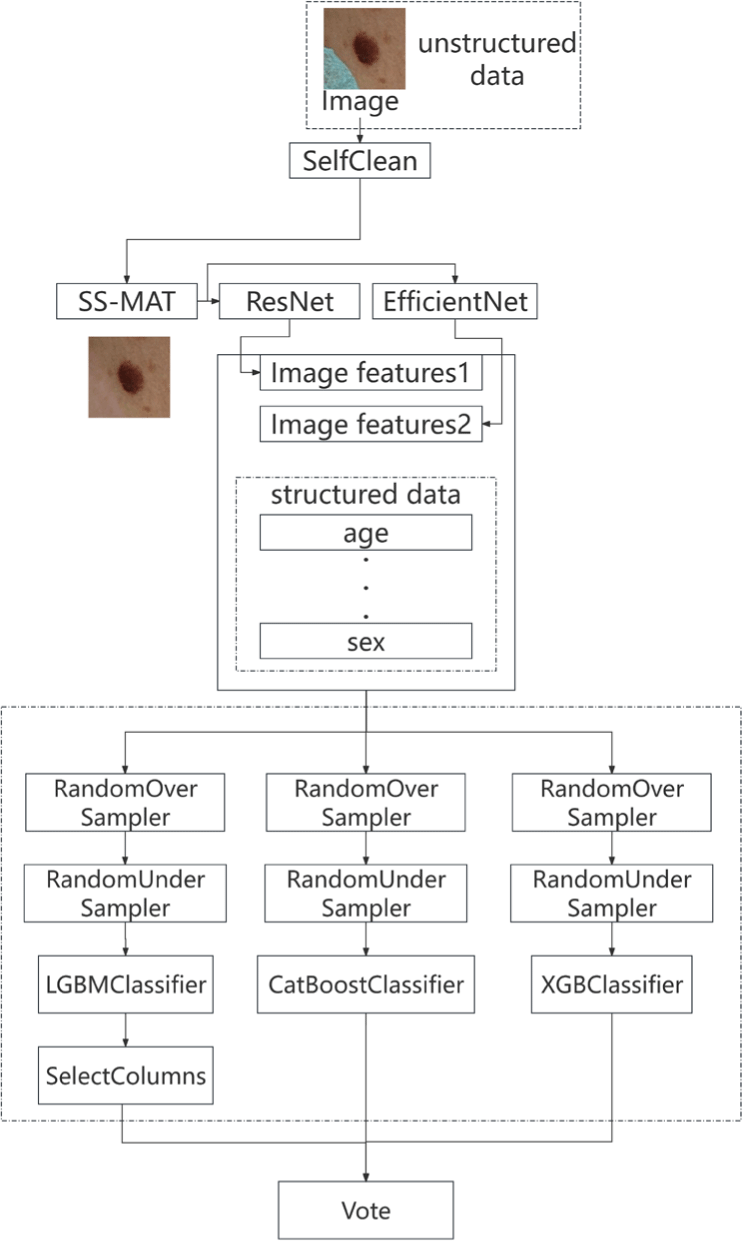
The flowchart of skin disease diagnosis in this paper is shown in Fig. 2.
-
Step 1: SelfClean
SelfClean is used to identify the occluded images.
-
Step 2: Repair
SS-MAT algorithm is used to repair the occluded samples. The SS-MAT algorithm can reasonably infer the possible shape of the occluded part based on the characteristics of surrounding normal tissues, thereby achieving precise repair.
-
Step 3: Image feature extraction
Deep learning models, ResNet [28] and EfficientNet [29], are used to extract image features.
-
Step 4: Data mining and cleaning
Image features and structured data are processed through various mathematical operations to obtain new data, and then the useless and redundant features are removed, resulting in a total of 71 features.
-
Step 5: Prediction
Finally, the combined features are inputted into three classifiers, namely LightGBM, CatBoost and XGBoost, which vote jointly to make the final decision.
We modified and optimized SS-MAT, which is an innovative method based on mask autoencoder. Its core structure mainly consists of two main parts: encoder and decoder, as shown in Fig. 3. In the encoder stage, SS-MAT automatically masks some areas of the image. These masked areas are randomly selected, and the occlusion rate is manually set, but usually very high, e.g., 60%.
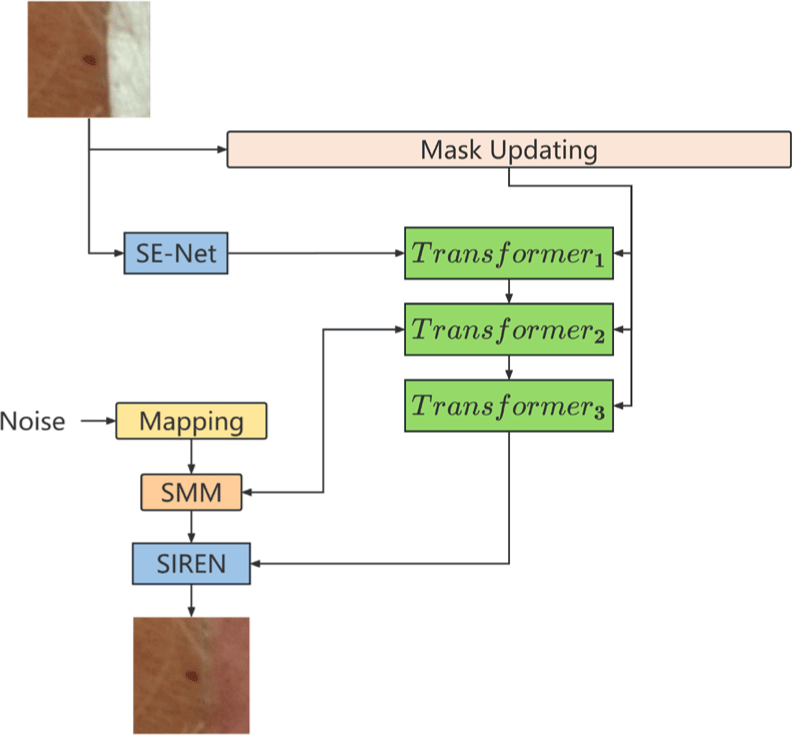
In the encoding process, only the unmasked parts of the image are processed, and SE-NET effectively improves the adaptability and sensitivity of the network to the importance of features at different channels [30], which compresses the feature map of each channel into a single value through a global average pooling operation, thus obtaining the global information between channels.
In the decoder stage, SS-MAT tries to recover the masked parts using the feature representations obtained from previous encoding that is combined with the contextual information of the image. The last step is SIREN, which has a network structure that allows learning richer and more representative features. Through the nonlinear transformation of the multi-layer sinusoidal activation function, the model can extract the features of different scales and frequencies in the video, which helps to recover the detailed information, such as textures and edges in high-resolution videos.
During the training process, SS-MAT optimizes the model parameters by minimizing the difference between the reconstructed image and the original image, using multiple loss functions weighted with non-saturated adversarial loss, R1 regularization, and perceptual loss to learn effective image repair patterns.
SE-Net in the encoder enhances the information interaction between channels in the convolutional neural network, and adaptively adjusts the response of channel features.
The SE-Net consists of three steps: Squeeze, Excitation and Scale. As shown in equation (1), where Xc denotes the c-th channel of the input feature map X, and Fsq denotes the squeezing operation.
The excitation operation is to learn the nonlinear relationship between the channels through the two fully connected layers to generate the channel attention weights s ∈ ℝC. As shown in equation (2), σ is the Sigmoid function.
The scaling operation is to multiply the channel attention weight s with the input feature map X channel by channel to get the adjusted feature map X′ ∈ ℝC×H×W as:
The traditional self-attention mechanism does not consider the mask information in the image when calculating the attention score. Let the input image features be X ∈ ℝN×C, where N is the length of the feature sequence and C is the dimension of the features. By computing the query Q, key K and value V, the traditional self-attention is:
In the mask-aware self-attention mechanism, a mask matrix M ∈ ℝN×N is introduced to indicate whether a pixel is in a mask region or not. In this way, the model can better distinguish the information in the masked and unmasked regions, thus capturing the global dependencies more effectively. The mask-aware self-attention is:
The mask M is used to identify the validity of a token, which is initialized by the input mask and automatically updated during propagation. The update rule is as follows: if at least one valid token previously existed in the window, all tokens in the window are updated to be valid after being processed by the attention mechanism. If all tokens in the window are invalid, they remain invalid after processing by the attention mechanism.
SIREN is a neural network that uses a sinusoidal activation function to model continuous signals. The content in an image has spatial continuity, like the edges of an object, texture and so on. The sine activation function has periodicity and continuity, which can effectively capture the spatial continuity of the image. When repairing damaged images, it can fit the image details more accurately. SIREN can combine the local and global information of the image. In image repair, it is able to focus on the detailed features of the local area to be repaired, and it considers the reasonableness of the repaired content from the perspective of the overall image [31].
Let the input vector be x ∈ ℝn, the input of the l-th layer of SIREN be hl−1 ∈ ℝml−1, and the output be hl ∈ ℝml. The computation of each layer of SIREN can be represented as:
In order to handle image information at different scales, the method adopts a multi-scale feature fusion strategy. Specifically, the model outputs feature maps at different scales in different layers, and then these feature maps are fused by a cross-scale feature fusion module. Let F1,F2,…,Fn be the feature maps of different scales, the multi-scale feature fusion module fuses these feature maps into a unified feature map FFusion through convolution and upsampling operations.
IV. RESULTS AND DISCUSSION
The experimental environment is: Intel (R) Xeon (R) E5-2680 v4 CPU @ 2.40 GHz, 64 GB RAM, NVIDIA RTX A4000×4 GPU, Ubuntu 20.04.3 LTS 64 bit, Python 3.7, PyTorch 1.8.0 and Torchvision 0.9.0 API.
There are about 2,500 high-definition unobscured skin-cancer images in ISIC2018 and about 400,000 data in ISIC2024. Both ISIC2018 and ISIC2024 datasets are randomly divided into training and testing sets with a ratio of 7:3.
The ISIC2018 dataset is used for the image repair task, and the image size is 256×256, in which the occluded parts are randomly generated, and the occlusion percentage is 50%, as shown in Fig. 4. The decay coefficient of Exponential Moving Average (EMA) is 10, the learning rate is 0.001, and the batch is 4. The number of convolutional channels and the dimension of the fully connected layer for the head, body, and reconstruction modules are both set to 180. The number of blocks and the window size of the three Transformer groups, which pass through the SE-Net first and then three more Transformer groups, are {2, 4, 2} and {8, 16, 8}, respectively. The final convolutional U-shaped network first downsamples the resolution to 1/32. Finally the mapping network consists of 8 fully connected layers, and the outputs are implemented by SIREN and convolutional layers followed by an average pooling layer.
ISIC2024 image dataset is processed using SelfClean technology to identify the occluded images. The samples with more than half of the occluded area are discarded, and the samples with less than half of the occluded area are repaired using SS-MAT.
ResNet, EfficientNet model are used to extract the features from the image on ISIC2024 dataset with a learning rate of 0.0001, a learning rate scheduler of CosineAnnealingLR, and a number of training rounds of 50, using 5-fold cross-validation.
15 significant features are selected from the categorized data using chi-square test. Another 15 significant features are selected from all data using mutual information classification. Screening continuous data with a variance threshold of 0.05. 71 features are obtained after the aforementioned three operations.
Three classifiers, namely LightGBM, CatBoost, and XGBoost, vote jointly to make the final decision. In order to find the optimal combination of hyperparameters, hyperparameter tuning in Optuna library is performed on the classifiers. The number of training epochs for hyperparametric tuning is 100. A soft voting strategy assigns empirical weights [0.31, 0.45, 0.29] to them, respectively.
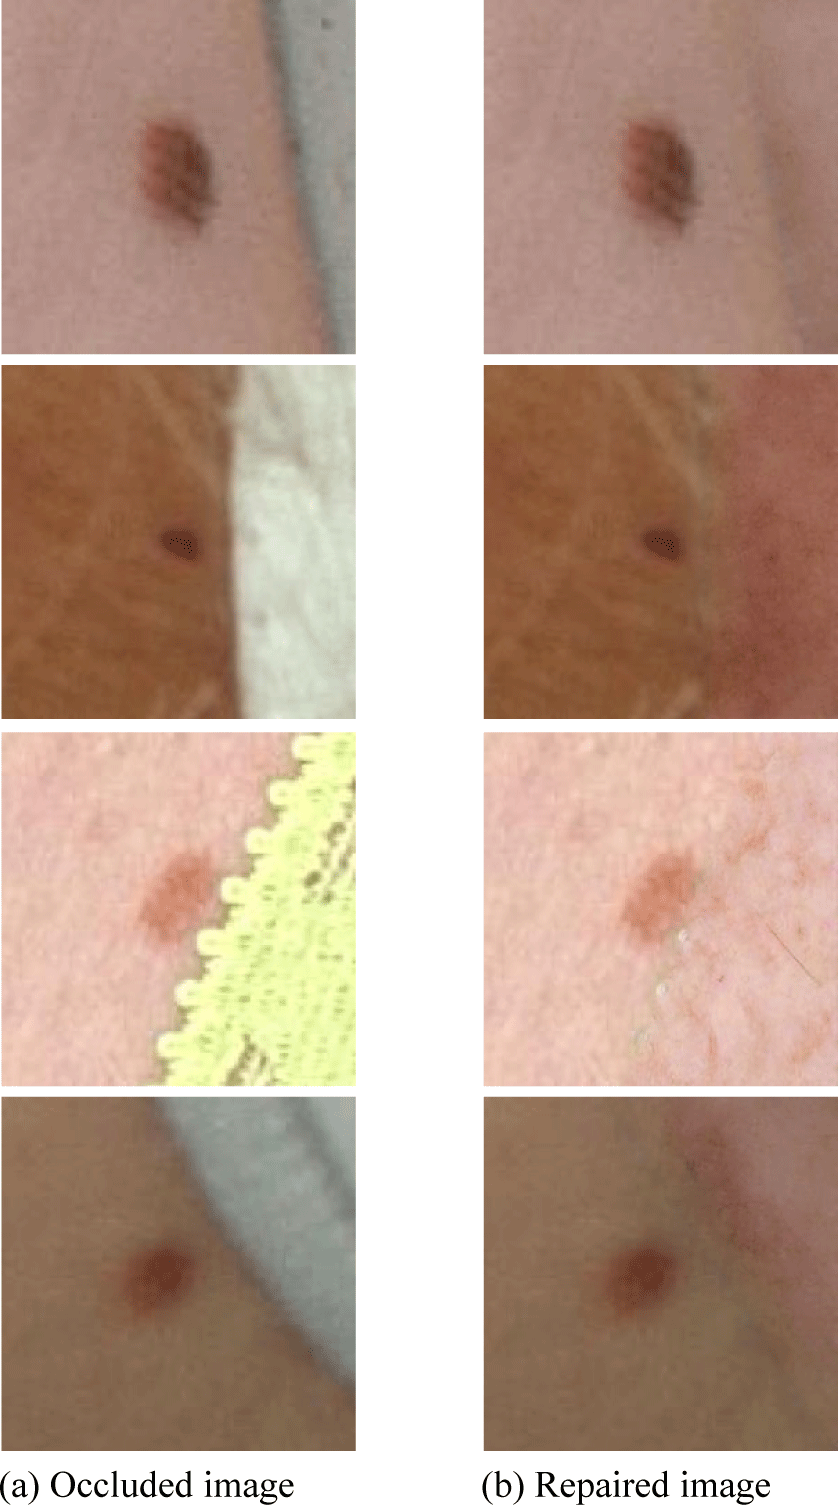
In medical imaging, the occlusion often interferes the observation of key lesions, bringing severe challenges to medical diagnosis. With the improved SS-MAT model, the image repair ability is more powerful, which can repair the occluded image with rich details, as shown in Fig. 5.
For the binary classification of malignant examples, submissions are evaluated using the partial area under the ROC curve above an 80% true positive rate (TPR). Given the high-sensitivity requirement for cancer diagnostic systems, the evaluation metric emphasizes the area under the ROC curve with TPR≤80%. Shown in Fig. 6, the shaded areas represent the pAUC(partial area under the ROC curve) values of two algorithms (Ca and Cb) at an arbitrary minimum TPR.
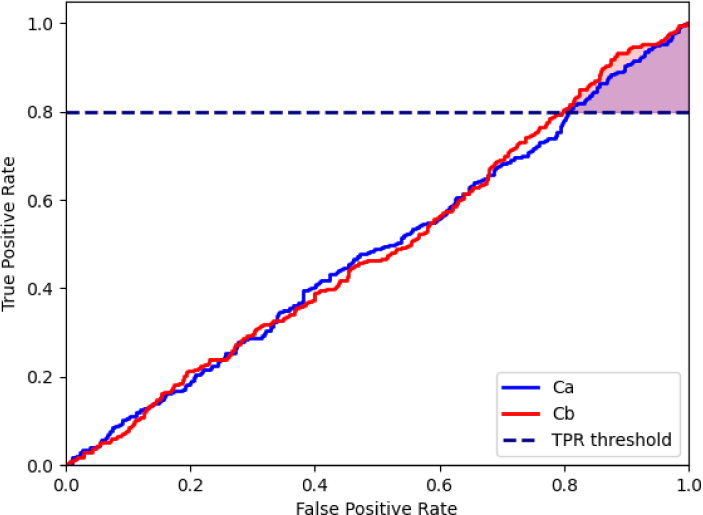
Its core idea is to compute a pAUC. The AUC value is computed within a specific false positive rate (FPR) range. Where α is set to 0.8, custom mtric scaled is the pAUC value in the range of [0,α].
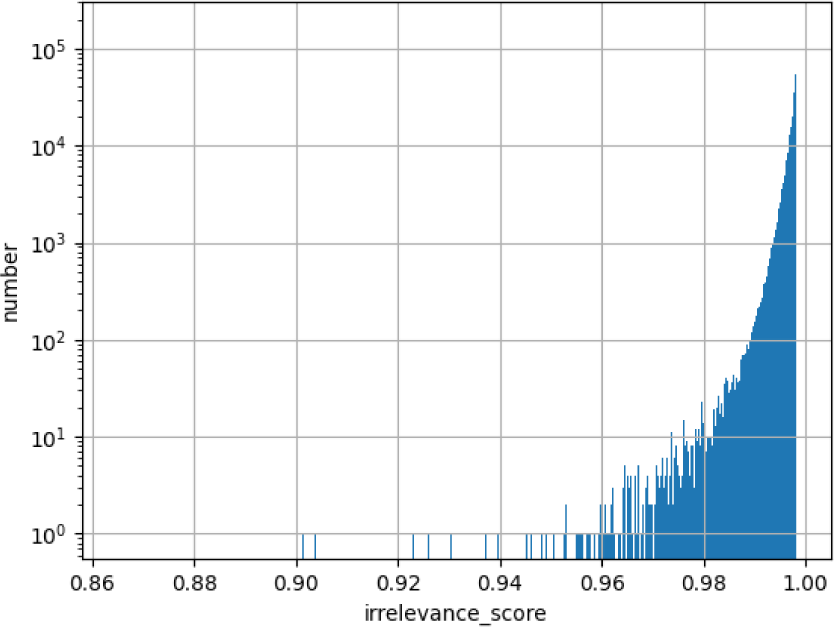
SelfClean scores the images with occlusions in the training data. The distribution of SelfClean is shown in Fig. 7. The smaller the irrelevance score is, the more severe the occlusion is. 0.96 means 50% occlusion.
The custom metric score is 0.1740 if only structured data are used. In order to further improve the performance, the features are thoroughly analyzed and screened, and unimportant data, which have low impacts on the predictions, are removed. After this operation, the custom metric score is increased to 0.1762. Next, in order to allow the model to learn more dimensional information, the custom metric score is improved to 0.1857 by integrating image features. Finally, in order to fully utilize the advantages of all classifiers, a soft-voting strategy is used to assign the different weights to the classifiers according to their performances, and the final custom metric score reaches 0.1935. The results are shown in Table 2.
V. CONCLUSIONS AND FUTURE WORKS
An automatic diagnosis model is constructed to predict the probability that a skin cancer case is benign or malignant. ISIC2024 dataset is used, which has heterogeneous data, including structured data and unstructured data. Structured data are mined and cleaned to generate more helpful data. In unstructured data, the occluded images are selected by SelfClean and repaired by improved SS-MAT. Deep learning models are used to extract features from the repaired images. The features extracted from structured data and unstructured data are inputted to three classifiers, which vote jointly to make the final decision. In future works, we will not only focusing on occluded images but also considering other special cases such as blurred images, make the repaired images more suitable for feature extraction.