I. INTRODUCTION
Realistic social network generation plays a critical role in modern computational social science, studies of information diffusion, and the evaluation of community detection and link prediction algorithms [1-3]. By creating synthetic networks that closely mirror key real-world characteristics such as dense local clustering, short average path lengths, and heavy-tailed degree distributions researchers can systematically test hypotheses and rigorously benchmark algorithms without relying solely on proprietary, sensitive, or noisy observational data [5]. Moreover, controllable simulated networks facilitate exploring “what-if” scenarios, such as assessing how policy interventions might alter network evolution, ultimately providing deeper insights into the mechanisms behind the formation and dynamics of large-scale online communities [4,25].
One of the most influential modeling approaches for capturing network community structure is the stochastic block model (SBM), originally proposed to represent networks divided into distinct groups or communities [6-7]. In a standard SBM, nodes are assigned to predefined blocks, with the probability of forming an edge depending solely on the block memberships of node pairs. This approach naturally leads to denser intra-block connectivity and sparser inter-block connectivity, effectively capturing modular network structure. Despite its conceptual elegance and analytical tractability, the classical SBM assumes a fixed set of nodes and static block memberships, making it less suited for modeling dynamic network growth and the heavy-tailed degree distributions commonly observed in real-world social networks [8-9].
In contrast, preferential attachment (PA) models explicitly address network growth through a “rich-get-richer” process, where new nodes preferentially connect to existing nodes in proportion to their degrees [10-11]. Introduced by Barabási and Albert, PA naturally yields networks characterized by power-law (scale-free) degree distributions, capturing critical empirical properties such as the presence of highly influential “hub” nodes and small-world phenomena like short average path lengths [2]. However, classical PA models typically lack explicit community or modular structure, producing networks that do not effectively represent the organized and modular nature commonly found in real-world social and information networks [9].
Recent works have attempted to bridge modeling gaps in SBMs by addressing complexities such as degree heterogeneity, overlapping communities, and hierarchical structures. For instance, the mixed membership sBM (MMSBM) allows nodes to exhibit partial memberships in multiple blocks, significantly enhancing modeling flexibility in applications like social and collaboration networks [12]. Hierarchical SBMs introduce nested block structures, enabling the modeling of community organization at multiple scales [13]. A particularly influential extension is the degree-corrected SBM (DCSBM) by Karrer and Newman [8], which incorporates node-specific degree parameters to reflect empirical heavy-tailed degree distributions. Although DCSBM significantly advances classical SBMs in capturing degree variability, it remains fundamentally static—assuming fixed nodes and block assignments, with degree corrections introduced through node-level adjustments. In contrast, our proposed growing stochastic block model (GSBM) explicitly incorporates dynamic node arrivals and preferential attachment, allowing block sizes to evolve naturally according to power-law–distributed community proportions and enabling hubs to form organically through growth processes. Additional recent variants have introduced scalable and probabilistic SBMs tailored to large-scale networks, further highlighting the importance of integrative models addressing dynamic growth, degree heterogeneity, and community structure [14-16,26].
While Dynamic SBMs also capture temporal network evolution, they primarily focus on tracking the reassignment or drift of block memberships for an approximately fixed set of nodes over discrete time steps [17-18]. By contrast, our GSBM explicitly models network growth through continuous node arrivals, probabilistic block assignment based on power-law community-size distributions, and edge formation guided by preferential attachment rules. This distinction is crucial when analyzing rapidly growing social networks, where heavy-tailed degree distributions and hub structures often emerge organically from growth-based “rich-get-richer” processes. Thus, while dynamic SBMs provide valuable insights into evolving block memberships in relatively stable networks, our GSBM offers a growth-centric and realistic generative framework suitable for networks undergoing substantial changes in size and community structure over time.
In this paper, we formally introduce our novel growing stochastic block model (GSBM), explicitly integrating preferential attachment with stochastic block structures to effectively capture both modular community organization and heavy-tailed degree distributions in real-world networks. Specifically, our contributions include: Formulating a dynamic generative process where new nodes sequentially join communities sampled from power-law block-size probabilities, ensuring realistic community-size heterogeneity.; Integrating preferential attachment-based edge formation rules within and across communities, enabling natural hub emergence.; Providing analytical insights and extensive simulation results demonstrating how our GSBM surpasses classical and dynamic SBMs, as well as pure PA models, in capturing structural phenomena observed in real-world social networks.
The structure of this paper is as follows. Section 2 provides the details of the proposed GSBM. Section 3 presents experimental evaluations. Conclusions and future research directions are discussed in Section 4.
By unifying SBM and PA principles, the proposed GSBM serves as a flexible, growth-oriented model significantly advancing our ability to generate synthetic networks that accurately reflect the complexity and dynamics of large-scale social and information systems.
II. METHOD
In this section, we formally introduce the growing stochastic block model (GSBM) and provide a detailed explanation of its preferential attachment (PA) mechanism.
The model operates through the following three main phases: (1) Initialization phase, (2) Intra-community edge generation phase and (3) Inter-community edge generation phase. The pseudocode for the GSBM algorithm is provided in Algorithm 1. We assumed graph object G has the following fields: V vertex set, E edge set and deg degree information of each vertex. Size of sets is represented as |E| in the pseudocode.
In the GSBM algorithm, the generate-community operation assigns the vertices numbered from 1 to n sequentially into k communities using power law distribution as shown in Algorithm 2. For this assignment, a power-law distribution of the form is used for each community, where i is the index of the community (line 15). While assigning a vertex to a community, it is ensured that the total number of nodes across all communities satisfies ∑|Ci|= n and the smallest community must have at least m2 nodes to support intra-community edge generation later (line 7-10). After the assignment, the function returns C ={C1,C2,…,Ck} set of communities (line 11-17).
GSBM(n, k, α, m1,m2)
1: Create G graph with n vertices
2: G.E = {}, w ← {0,0,…,0}
3: C ← generate−yicommunity(n,k,α)
4: For Ci ∈ C
5: S ← initialize − community(G,Ci),m2)
8: For v ∈ S
9: w [i] ← G.deg[v]/(2⋅|G.ECi|)
10: e ← random value in range [1,2m2]
11: R ← { e nodes selected randomly from S using w weight}
12: For v ∈ RG.E ← G.E ∪{(u,v)}
13: Increase G.deg[v],G.deg[u] by one
14: S ← S ∪{u}
15: For Ci ∈ C
16: V′ ← G.V/Ci
17: For u ∈ Ci
18: For v ∈ V ′
19: w [v] ← G.deg[v]/|G.EV′|
20: e ← random value in range [0,2m1]
21: R ←{ e nodes selected randomly from V′ using w weight }
22: For v ∈ R
23: G.E ← G.E ∪{(u,v)}
24: Increase G.deg[u],G.deg[v] by one
25: Return G
In this stage, only intra-community edges are generated and added to the network. Since the communities initially have no internal edges, the first m_2 nodes in each community are connected using a power law initialization. This is done via initialize-community operation shown in Algorithm 3.
For each of the first m2 nodes, node i is connected to max other nodes within the same community. So that each of the first m2 nodes will have at least one edge. First, sets S and R contain the first m2 nodes of the community (line 3, Algorithm 3). The algorithm iterates through S set and connects each node in S to randomly chosen |R|/step number of nodes in R. Then, current node is removed from R once it connected to the chosen nodes (line 49). After the first m2 nodes are initialized, the algorithm continues with the rest of the nodes as show in Algorithm 1.
Each remaining node is considered in order. For each node, it is connected to a randomly chosen number e of previous nodes using a preferential attachment mechanism. The value of e is randomly selected between 1 and 2m2 to induce a diversity in degree distribution. For preferential attachment, the probability weight for connecting to a node v is calculated as where G.deg [v] is the degree of node v and |G.ECi| is the number of edges in community i. This process encourages high-degree nodes to attract more connections, mimicking real-world social networks.
Each node in the network, in addition to being connected within its own community, will also connect to up to 2m1 nodes from other communities (line 16–25, Algorithm 1). The number of such external connections e is randomly selected from the interval e ∈[0,2m1]. These e nodes to connect with are chosen using the principle of preferential attachment, where the nodes are selected based on weighted probabilities. In this case, the probability weight of node v is where G.deg[v] is number of degrees of node v and |G.EV′| is number of edges formed in subgraph V′ (line 19, Algorithm 1).
By combining preferential attachment mechanism both within and between communities, the GSBM algorithm maintains dense intra-community connectivity while also introducing rare but strong inter-community connections across the entire network. This enables the model to more realistically represent the clustered and hierarchical structures commonly observed in many real-world networks.
III. EXPERIMENT
We tested our proposed GSBM model by comparing it with state of the art algorithms such as Barabási–Albert (BA) [10], Erdős–Rényi (ER) [23], the traditional SBM [6] and degree corrected SBM [16]. When generating networks using these methods, we aimed to make them as similar as possible to facebook and condmat data. The number of nodes, number of edges, and average degree were matched to those of the benchmark data.
The real-world dataset we used, referred to as facebook, is widely known and serves as a benchmark dataset in social network analysis. The nodes of this graph represent Facebook users and the edges represent friendship connections between them [22]. We refer to this dataset as FB (short for facebook). Condmat dataset is a collaboration network between the scientist who submitted paper to condensed matter category of arxiv. Nodes represent authors and edges represent coauthorship relation. We will refer to this dataset as CD (short for condmat).
We compared the synthetic networks generated using the aforementioned models against these two benchmark networks. We used implementations in networkx library for generating BA and ER networks. We did our simple implementation for SBM and DCSBM models.
Structural information of the generated networks are compared using five key network metrics: clustering coefficient, diameter, average shortest path (ASP), degree assortativity, and modularity. Modularity is measured by Louvain method. Also, degree distribution of the generated networks is analyzed using degree frequency histogram.
We investigated how structural properties of a network evolve as the parameter α increases from 1.1 to 2.0 in Table 1.
The clustering coefficient, which reflects the tendency of nodes to form tightly-knit groups, decreases steadily as alpha increases. Starting from approximately 0.141 at α=1.1, it drops to 0.123 at α=2.0. This trend suggests that local connectivity becomes less cohesive, possibly due to one giant community and the rest of the communities are getting smaller and smaller.
The network diameter remains mostly stable at 6, with a slight dip to 5.8 at alpha=1.8. This indicates that the maximum shortest path between any two nodes in the network is largely unaffected by changes in α.
ASP shows a monotonic decline from 3.004 to 2.821 as α increases. This implies that, on average, nodes can reach each other in fewer steps, suggesting a transition towards a small-world topology where distant parts of the network become more interconnected.
Degree assortativity initially increases from 0.018 to a peak of 0.030 at α=1.8, followed by a slight decrease at α=2.0. This pattern indicates a growing preference for nodes to connect to others with similar degrees up to a point, possibly forming assortative clusters, after which this tendency slightly weakens, hinting at a shift towards more heterogeneous or random connectivity.
Modularity, a measure of the strength of community structure, exhibits a significant decline from 0.672 at α=1.1 to 0.464 at α=2.0. This trend reflects the progressive erosion of clear community boundaries, suggesting that the network becomes increasingly homogeneous and less compartmentalized as α increases.
Overall, increasing the α parameter results in networks that are less clustered and modular, more condensed in terms of path length, slightly more assortative (up to a point), largely unchanged global diameter and degree distribution. The α parameter set to lesser value seems to show good performance except for degree assortativity and α=1.2 seems appropriate for this experiment.
As for the parameters m1 and m2 directly affect average number of degrees and m2 is chosen close to the average number of degrees of the benchmark network. The m1 parameter is set to 1 and 2 in FB and CD benchmarks respectively since too much inter-community edges blur community structure.
The parameter k sets the number of communities. Increasing k improves structural properties of the network but it affects degree distribution and heavy tail disappears. Also, larger k produces many small communities and some of them are disconnected from the rest of the network.
When generating a network using the traditional SBM algorithm, we aimed to match the number of nodes and average degree to those of the benchmark dataset. This algorithm takes as input the number of nodes n, the number communities k and their sizes, and a probability matrix P that defines the likelihood of edge formation between and within communities. We used the same community size distribution as in GSBM. The probability matrix P was constructed using equations 1 and 2. Specifically, equation 1 was used to determine the probability of edge formation between nodes within the same community, while equation 2 was used for nodes belonging to different communities. Here, ni and nj represent the number of nodes in community i and community j, respectively; k is the number of communities; and davg denotes the average degree.
This same probability matrix is used for DCSBM. But, there is a degree correction probability for each node v represented as θv. We need to note that we initialized θv with uniform random distribution from 0.25 to 1.75.
When generating a network using the BA model, we used the number of nodes n and the number of connections each new node can make, denoted by p, based on the node count and average degree of the benchmark dataset.
For the ER method, we set the number of nodes n to match that of the benchmark dataset, while the edge formation probability p was determined using the equation 3 where n and m represent the number of nodes and edges in the benchmark dataset, respectively.
The purpose of setting the probability in this way is to ensure that the average number of edges per node closely resemble the average degree in the benchmark dataset.
The GSBM algorithm takes the following parameters: the number of nodes n, the number of communities k, the power distribution coefficient α for community sizes, the number of inter-community edges m1, and the number of intra-community edges m2. To align the average degree with that of the benchmark graph, the parameters were chosen such that m1+m2 ≈ davg. In our experiment, we used the parameter configuration shown in Table 2 after parameter tuning.
| condmat | ||
|---|---|---|
| n | 4,039 | 23,133 |
| k | 5 | 1,500 |
| α | 1.2 | 1.01 |
| m 1 | 1 | 2 |
| m 2 | 22 | 3 |
The overall properties observed across the entire network are referred to as global characteristics. A comparison of these global characteristics for the networks generated by different algorithms is presented in Table 3.
The average degree indicates how many people, on average, each individual is connected to. In the benchmark network, the average degree is 21.8, which suggests that it is a relatively dense network. Higher density in a network implies faster spread of diseases or quicker dissemination of information. In social networks, a high degree often indicates that the individual holds significant influence [19]. The fact that the average degrees of all the synthetically generated networks are close to that of the benchmark network shows that the parameters we used to generate these networks similar to FB are appropriate.
Clustering coefficient measures average number of triangles a node is a part of. From structural point of view, it measures tendency to form tightly knit groups with their adjacent nodes. In real world networks where every body form friendship this tendency is frequently observed [28]. Clustering coefficient of FB network is 0.605 meaning that for each node, more than half of its pair of friends share a triangular relationship. The synthetic networks show significantly lower clustering coefficient compared to FB. However, GSBM shows 0.136 which is almost ten times greater than other three networks.
In terms of diameter, the GSBM-generated network most closely resembles the benchmark network. To compute the diameter, we first calculate the shortest paths between all pairs of nodes and then select the longest among those shortest paths, based on the number of nodes involved in each path. In social networks, due to the small-world effect, it is often possible for any two individuals to be connected through a chain of friends up to six or fewer [21]. The fact that the GSBM network has a diameter of 6 indicates consistency with real-world social networks while the others have a diameter of 4, suggesting they are overly compact.
ASP of FB benchmark was 3.7, indicating that information typically spreads across the network in 3 to 4 hops. The GSBM algorithm achieved an ASP of 3, making it the closest match to the benchmark. In contrast, the ASP values for the other synthetic networks were 2.5 and 2.6, which suggests they are overly compact.
The degree assortativity coefficient measures whether nodes tend to connect with others that have similar degrees. This metric ranges from −1 to 1, where positive values indicate a tendency for nodes to connect with others of similar degree, and negative values indicate the opposite. In real social networks, this measure is important as it reflects patterns like wealthy individuals befriending other wealthy individuals, or highly connected people being friends with others who are also highly connected. The FB benchmark network exhibited a positive assortativity coefficient, and GSBM also showed a positive value, indicating structural consistency with real-world social networks. Compared to the FB network, the assortativity score of GSBM was only 0.04 lower, which is a relatively small difference. On the other hand, the SBM algorithm showed highest negative number among all the models meaning its connections are not following real world tendency. Both the BA and ER models produced values near zero or slightly negative further highlighting their limitations in capturing this real-world property.
We analyzed structural metrics of GSMB over 20 runs with the same parameters in Table 4. Standard deviation shows minimal variations across all metrics meaning that GSBM is stable and consistent with input parameters.
| Cluster coef | Diameter | ASP | Deg assort | Modularity | |
|---|---|---|---|---|---|
| Mean | 0.138 | 6.00 | 2.990 | 0.020 | 0.654 |
| Std | 0.002 | 0.00 | 0.004 | 0.005 | 0.003 |
Analyzing the degree distribution of a network is crucial for understanding its structural characteristics. In social networks and many other real-world networks, the degree distribution often follows a heavy-tailed power-law distribution [27]. This indicates the presence of a small number of highly influential nodes or “hubs” within the network. Figure 1 shows the degree distributions of networks generated by the different algorithms. As observed in the figure, the FB network demonstrates the most pronounced heavy tail, followed by the BA and GSBM models. The tails of the BA and GSBM distributions are quite similar. But BA produces wider tail than GSBM. Hubs of FB benchmark are not replicated in GSBM and BA since they are cut off around 450 and 500 respectively.
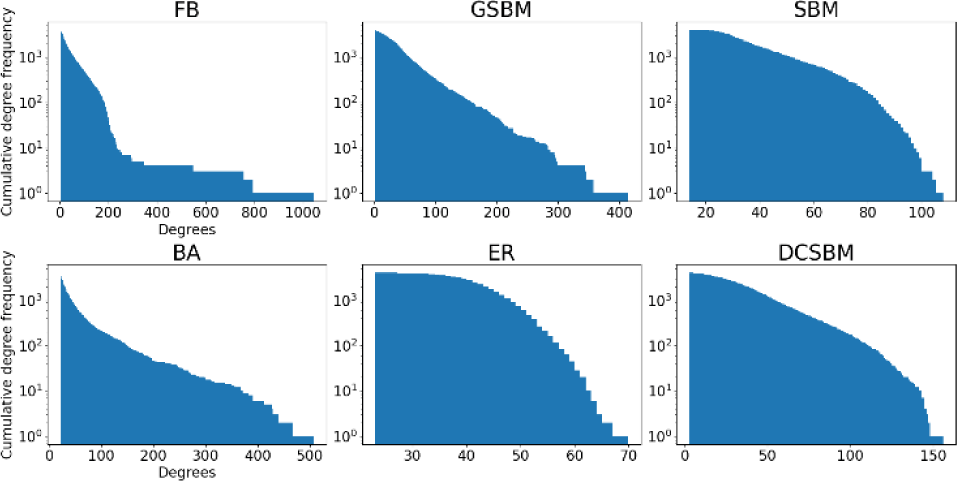
In contrast, the SBM, ER and DCSBM networks look particularly uniform. The ER model’s degree distribution appears to follow a normal distribution, which reflects the algorithm’s behavior to create connections uniformly, resulting in nodes with degrees close to the average. The SBM and DCSBM algorithms fail to reproduce a heavy tail for FB benchmark. However, a modified version of SBM combined with a preferential attachment (PA) mechanism is observed to successfully produce a heavy-tailed distribution. This suggests that while SBM captures community-based structure well, it requires augmentation (e.g., with PA) to reflect real-world degree heterogeneity.
Table 5 contains CD benchmark results. CD network displays a high clustering coefficient (0.633), large diameter (15), relatively long average shortest path length (ASP=4.56), moderate positive degree assortativity (0.134), and strong community structure (modularity=0.731). GSBM approximates CD most closely across several metrics. While its clustering coefficient (0.097) is substantially lower than CD’s, it retains a relatively comparable ASP (4.76) and modularity (0.619), suggesting that it captures global structure and community separation reasonably well. In contrast, the SBM shows severe limitations, with nearly nonexistent clustering (0.001) and strong disassortative mixing (−0.281), indicating its inability to mimic both local cohesion and realistic degree correlations. Also, BA and ER models both show extremely low clustering, 0.003 and 0.000, respectively and weak or negative assortativity, diverging significantly from CD in both local and mesoscopic structure. DCSBM introduces some improvements by modeling degree variability, but still lacks sufficient clustering which is 0.002 and exhibits strong disassortativity, which contrasts sharply with CD’s positive assortativity. Overall, GSBM emerges as the most structurally close model to CD, especially in preserving path-based and community-level characteristics, though no model fully captures CD’s high clustering or assortative nature. These results highlight the importance of incorporating both degree heterogeneity and realistic local connectivity patterns when modeling complex real-world networks.
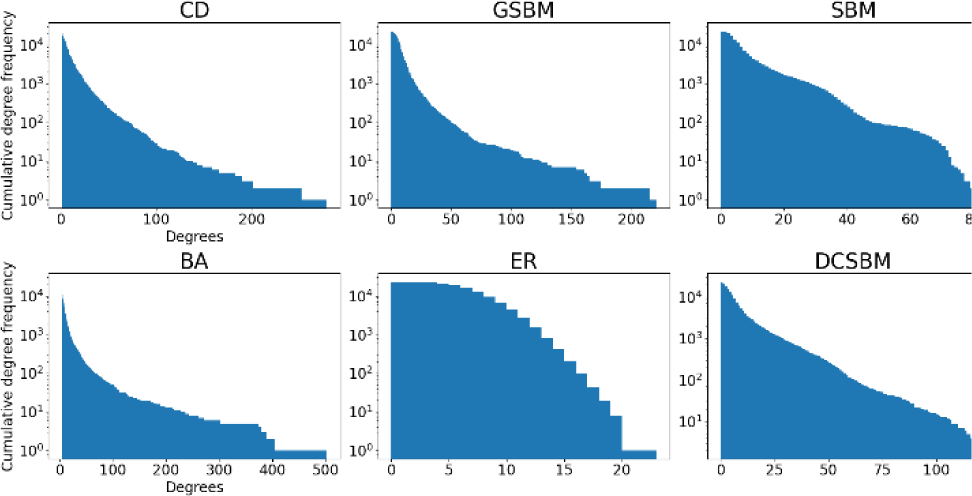
Scale-free and heavy-tailed nature of CD benchmark can be seen in Figure 2. GSBM closely resembles the CD network, displaying a similarly heavy-tailed distribution with a wide range of degrees, though slightly truncated at higher values. Also, its maximum number of degrees is very close to CD. DCSBM also provides a good approximation, effectively capturing the degree heterogeneity resulting in a distribution that decays more gradually than the basic SBM. The BA model replicates the power-law nature of the CD network but overshoots in the production of hubs, generating a longer tail with excessively high-degree nodes, which may not be close representative of the CD network. Lastly, ER model shows a rapid exponential decay in its degree distribution, reflecting a highly homogeneous structure with limited degree variance, and thus fails to capture the scale-free characteristics of the CD network.
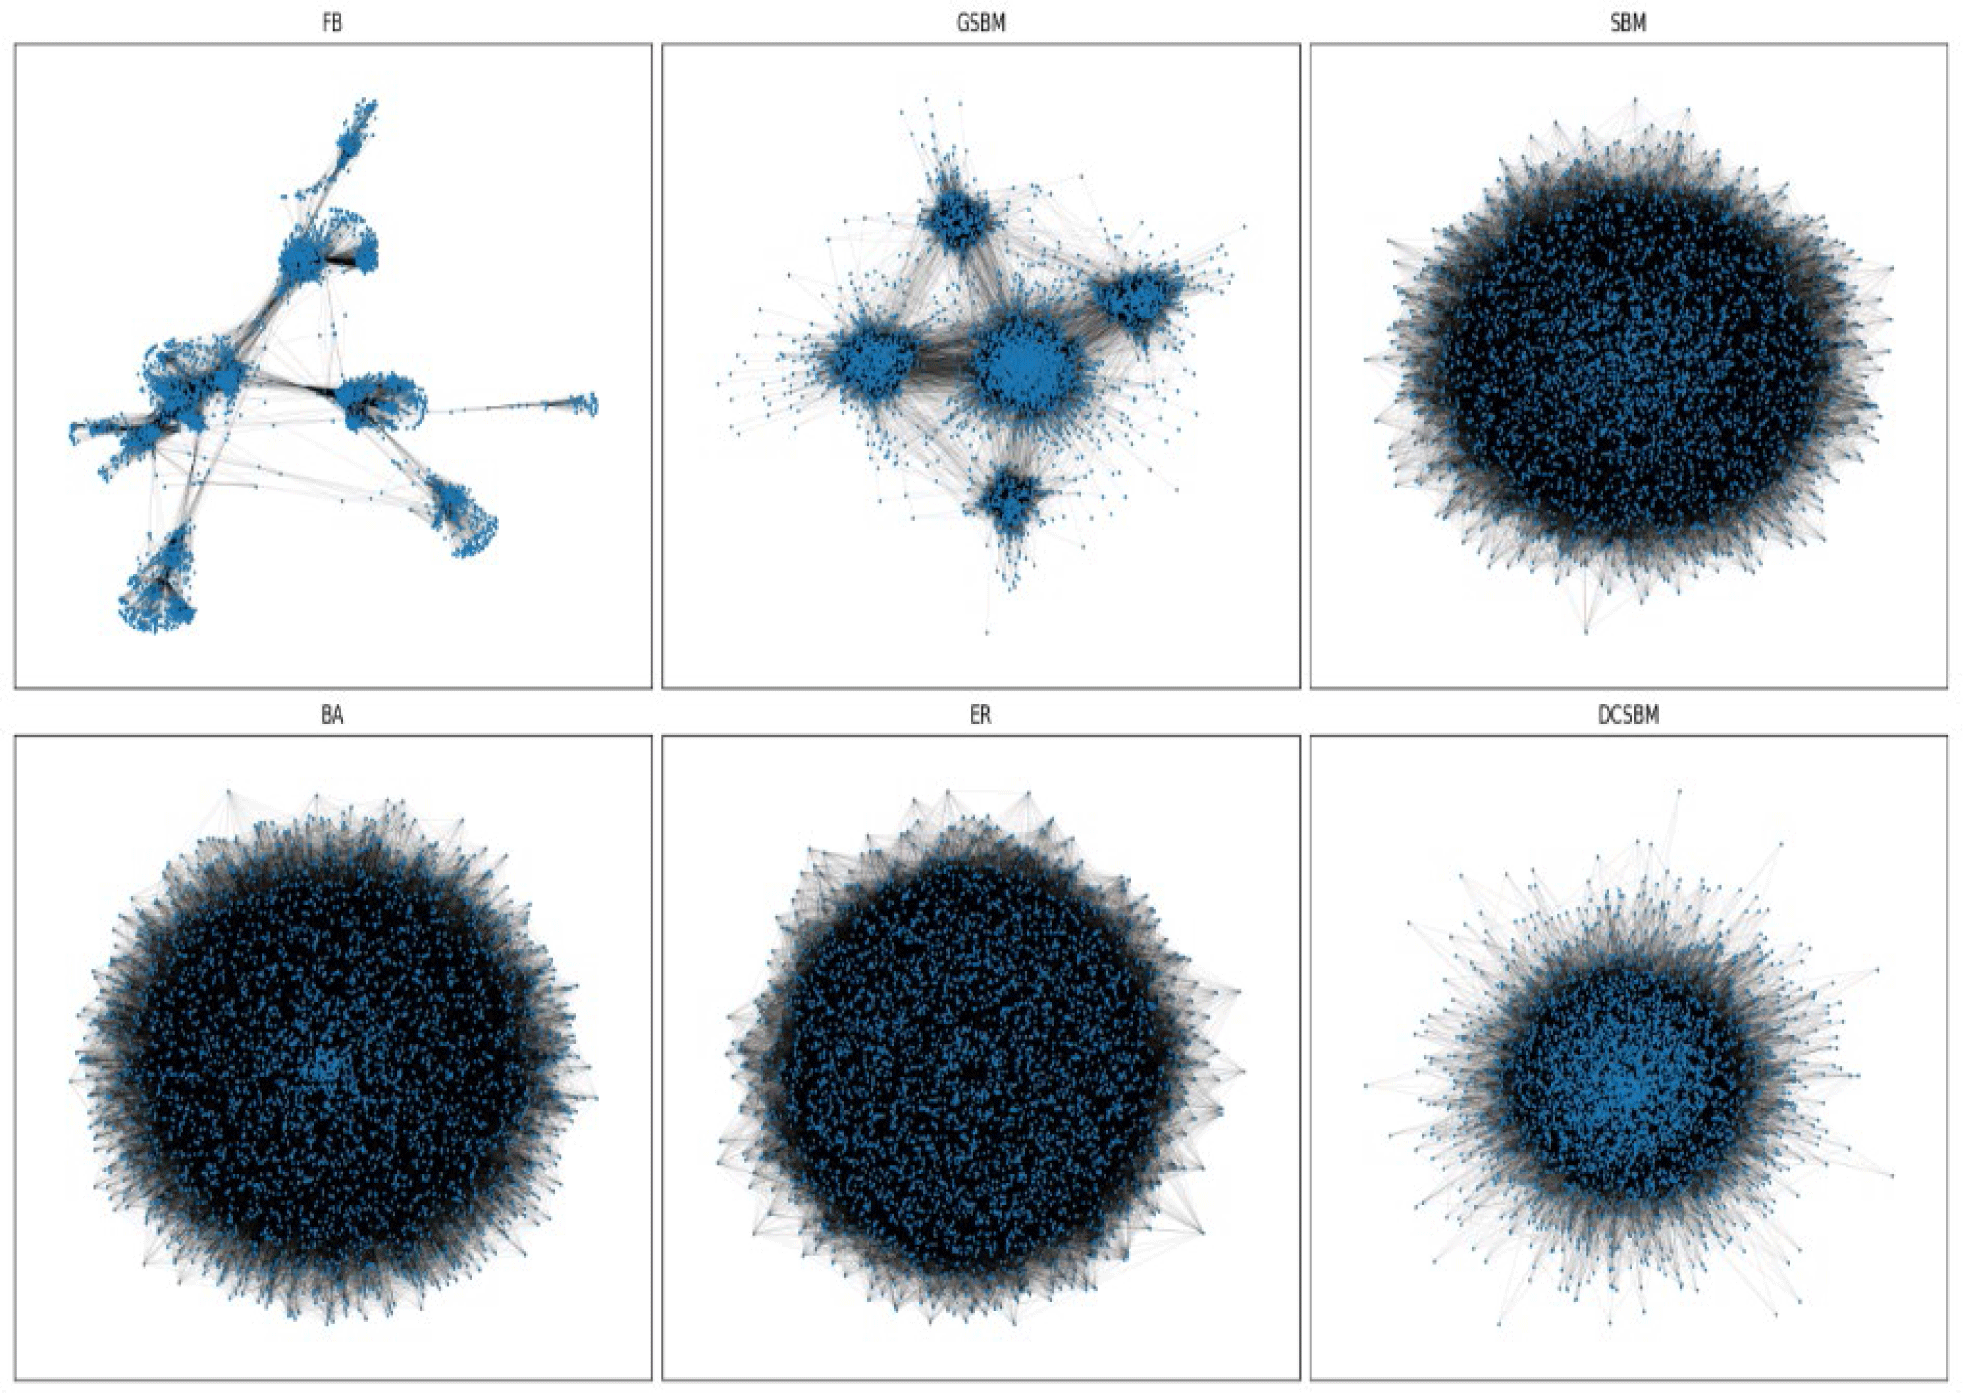
The networks generated by the different algorithms were visualized using the spring layout function from the networkx library, as shown in Figure 3. In the figure, the FB network clearly displays multiple distinct communities, with communities distinctively spread over indicating the absence of direct edges between certain communities. This reflects the real-world nature of social networks, where tightly-knit clusters may have little to no direct connections with others. The GSBM-generated network displays five distinct community structures, which directly corresponds to the parameter k=5. All communities are interconnected with direct edges, a feature consistent with the SBM-based modeling that GSBM builds upon. Although the SBM algorithm also models community structure, its visual output fails to reveal clear group separations. This is likely due to the dense interconnections between the communities, which obscure community boundaries and make them visually indistinct. In contrast, the BA and ER models do not incorporate any form of community modeling, and as expected, their resulting network visualizations show no obvious group structures. Their layouts appear more homogeneous, lacking the modularity seen in the FB or GSBM networks.
IV. CONCLUSION
We proposed the GSBM model by combining the traditional SBM model with the preferential attachment (PA) mechanism and compared its results with modern methods. The experimental results demonstrate that the GSBM algorithm is capable of generating synthetic networks that closely resemble real-world structures. The degree distribution of networks generated using GSBM exhibits a heavy-tailed pattern, which is commonly observed in real-world social networks, and the network retains a clear community structure. The average shortest path length in the GSBM-generated network is 0.4 longer than those generated by the BA, SBM, and ER methods, and 0.7 shorter than that of the real network. The degree assortativity of the GSBM network is the highest among all the synthetic networks at 0.026. These findings suggest that the GSBM-generated network is the closest to the benchmark network.
As for future improvements, the current version of the GSBM algorithm creates links between all community pairs, which does not fully align with real-world network structures. For example, in the FB network, some communities are connected to only one other community directly meaning that it has to go through this community to interact with the rest of world. Incorporating this feature into GSBM may lead the generation of synthetic networks that more accurately reflect real-world social network structures.