I. INTRODUCTION
Printed circuits board (PCB) is one of the key concepts in electronics used in different fields of industry. Usually, pattern recognition [1] and computer vision [2] algorithms are used to read and identify characters on PCBs for lot integrity and machine control. However, it is essential to understand the limitations and capabilities of OCR applications. While it is a great tool, it is not perfect. These OCR algorithms do not work well during pattern matching when new fonts are encountered, or input character images are unreadable which increases the error of classifier during the classification process. In machine learning, we often need to train a model with a very large dataset of thousands or even millions of data. The higher the size of the dataset, the higher its statistical significance and the information it carries, but we don’t think if such a dataset is useful or if we can reach a satisfying result with a smaller and much more manageable one. Selecting a reasonably small dataset carrying a good amount of information can make us save time and money. Instead of learning from a huge population of many records, we can make a sub-sampling of it by keeping all the statistics intact. Fundamentally, visualization techniques are widely recognized to be powerful in analyzing datasets [3], since they take advantage of human abilities to perceive visual patterns and interpret them.
Different concepts of data reduction depending on the objective of the reduction task exist and they can be applied to obtain a reduced representation of the dataset that is much smaller in volume also closer to the integrity of the original data [4]. There are different techniques for data reduction task which has led to two approaches depending on the overall objectives. The first is to reduce the quantity of data [5], while the second focuses on selecting a subset of features from the available ones.
In this study, we will focus on the first approach which deals with the reduction of the number of data in the large dataset [6] by using a grid-based algorithm which reduces a dataset by keeping its original data distribution. Therefore, instead of dealing with a large size of the dataset, we can use these data reduction techniques to visualize or analyze without losing important information. Although more and more raw data is getting easy to be accessed nowadays, much of these data have class-imbalanced distribution problems where a few classes have enough data while others only have limited data. This data imbalanced can lead to unexpected mistakes and even serious consequences, especially in OCR application classification tasks. This is because the skewed distribution of class instances forces the classification algorithms to be biased to the majority class which results in a quite poor classification performance [7]. Therefore, in order to reduce these OCR limitations, we propose a way of selecting good quality and balanced training datasets from a large dataset for PCB character recognition using a deep learning model.
The main motivation for this study is to:
-
to replace large datasets by a small subset much smaller in volume, yet closely maintains the integrity of the original data.
-
to address the problem of class imbalance in deep learning. Different forms of data augmentation are proposed to balanced minority class in order to improve optical character recognition (OCR) character classifier accuracy.
-
to analyze and confirm the effects of the proposed data preparation techniques on PCB character classification tasks using deep learning model.
The rest of the paper is organized as follows. In section II we discuss background and related work. Section III describes our data reduction techniques on grid-based sampling and some data augmentation techniques. Section IV we verify the effects of data preparation on neural network model and finally, our paper ends with a conclusion and future work in section V.
II. RELATED WORK
Many kinds of research were conducted to improve the performance and the effectiveness of OCR system, especially the handwriting character recognition which is and still a big challenge for OCR because, in handwriting, character styles are different from one person to another.
In [8], they study a common difficulty often faced by researchers exploring handwriting recognition in low-resource scripts and try to overcome the limitations of generic data augmentation strategies by proposing a modular deformation network that is trained to learn a manifold of parameters seeking to deform the features learned by the original task network.
By the availability of GPU with limited memory and computing resources, researchers propose an efficient deep architecture having a limited number of parameters, which can be trained on a low memory GPU for character recognition [9].
They also presented a robust and fast word spotting system for historical documents in [10] by proposing a novel approach towards word spotting using text line decomposition into character primitives and string matching but the problem is that the use of non-popular characters in historical documents decreases the performance. In this study, we will build a model to classify PCB characters.
ResNet can have a very deep network of up to 152 layers by learning the residual representation functions instead of learning the signal representation directly. ResNet introduces skip connection (or shortcut connection) to fit the input from the previous layer to the next layer without any modification of the input, the reason why it has less parameter and less training time than VGGNet [12], DenseNet [10]. Skip connection enables to have a deeper network but, in this work, we use ResNet v2 using 56 layers which reach in [11] 93.63% accuracy.
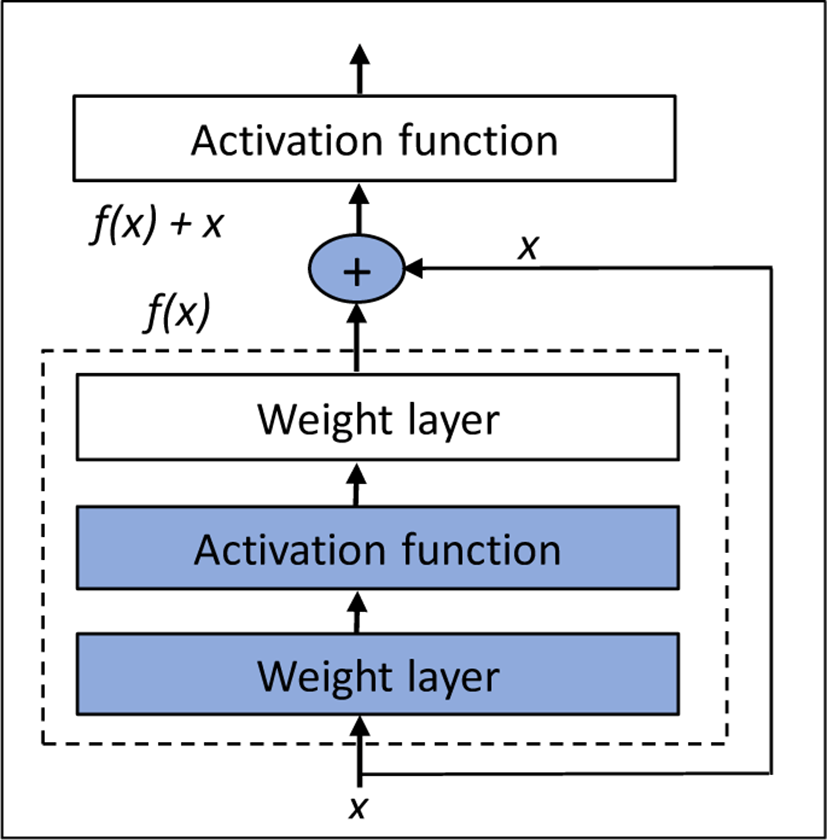
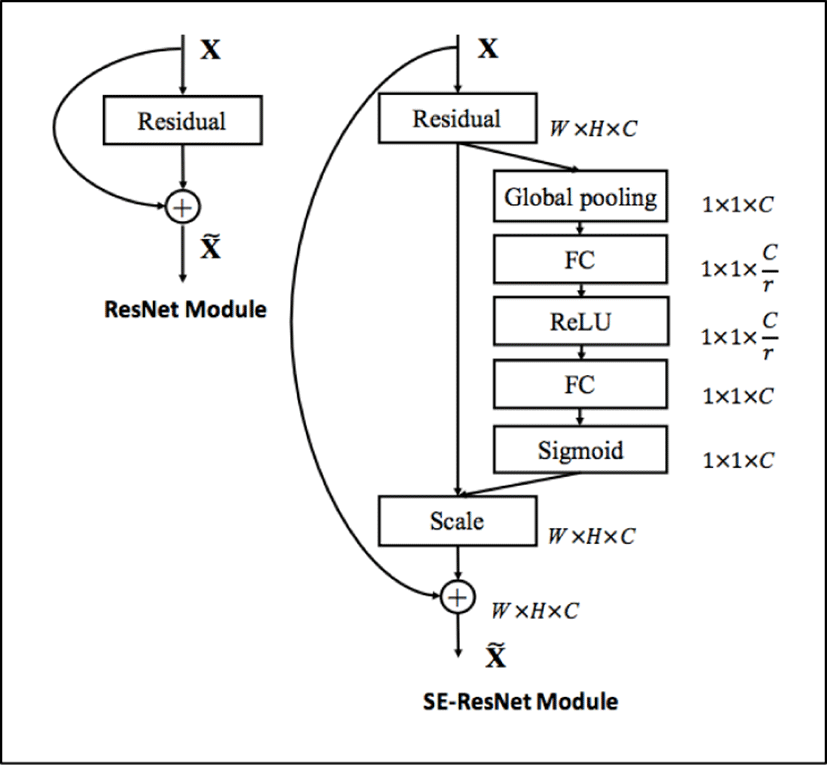
This is among of studies on various structures that can efficiently handle features. The idea of Squeeze-and-excitation (SE), won ILSVRC 2017 classification challenge, can recalibrate feature maps through existing networks. Fig. 2 [13] shows the corresponding structure. SE consists of a Squeeze operation that summarizes all the information about the feature map, and an excitation operation that scales the importance of each feature map. It can be attached to VGG [12], GoogLeNet (Szegedy et al. 2014), ResNet [11] or any network. In addition, the model performance improvement is very high compared with the increase of the parameters. This model advantage is that model complexity and computational burden do not increase significantly. In this study, we used ResNet and SE-ResNeXt model, the SENet applied to ResNeXt which is known as ResNet’s next model.
SE block as shown in Fig. 2, intrinsically introduces dynamics conditioned on the input, helping boost feature discriminability. There will be very minute increments in-terms of params and computations (GFLOPS) because of extra layers like FC and pooling operations respectively.
Sampling is to draw n samples representing characteristics of an entire population with N size. The aim of sampling is to describe or to make inferences about a larger population with the statistics computed from a smaller sample. In general, however, there are the probability and the nonprobability-based sampling methods; the most used sampling methods are simple random sampling, systematic sampling, stratified sampling, and cluster sampling.
The simple random sampling (SRS) is the most applied method in which each unit in a population has the same chance (1/N) of being selected.
Simple random sampling is a very basic type of sampling method and can easily be a component of more complex sampling methods. The main attribute of this sampling method is that every sample has the same probability of being chosen.
The samples can be drawn in two possible ways. The sampling units are chosen without replacement in the sense that the units once are chosen, are not placed back in the population.
The sampling units are chosen with replacement in the sense that the chosen units are placed back in the population. This SRS have some advantages because it helps to reduce any bias involved compared to any other sampling methods also it is usually easy to pick a smaller sample size from the existing larger population. SRS is simple as its name indicates, and it is accurate. These two characteristics give simple random sampling a strong advantage over other sampling techniques [15]. However, among the disadvantages are difficulty gaining access to a list of a larger population, time, costs, and that bias can still occur under certain circumstances.
In the past researches, sampled datasets have been widely studied in computational geometry. They were introduced first by Agarwal et al. [16] for approximating a set of points with a smaller set while preserving some desired criteria. Har-Peled and Mazumdar [17] give an alternate solution for sampled datasets that include points, not in the original set. Feldman et al. [18] demonstrate that weak sampled dataset representations can be generated with the number of points independent of the underlying data distribution. These formulations have recently been applied to several problems within computer vision and machine learning, and are primarily used to approximate a set of N points in d dimensions, with a smaller set of n << N points, while preserving some criterion such data distribution [19].
When the hardware store data and the environment for transmitting digital data were unsatisfactory, researchers were eager to collect large amounts of data, but now they want to use large amounts of data efficiently. It takes time to use a lot of data for learning purposes, which can slow down the application of a model using any machine learning technique, researchers have long worked to create a core set that geometrically implies information. In other words, it is important to find the data that can contribute the most to the model training among the training data, and less data than the entire dataset is called sampled dataset, a data-summarizing framework, to produce a small weighted set of data that provably correctly approximates the original big data. To find it, researchers usually use models like K-means, Regression, and Single Value Decomposition (SVD), but also Surrogate to find them quickly [20], [21].
This is an important step in data analysis because it is the act of taking information (data) and placing it into a visual context, such as a map or graph, it also make big and small data easier for human brain to understand, to detect patterns, trends, and outliers in groups of data [3]. Visualizing data using the appropriate techniques can reveal insights which the decision-makers can incorporate in their decision-making pipeline in order to make informed decisions that are driven by data [22].
In this paper, we propose to improve the sampling technique because it may lose a lot of important information contained in the dataset [16]. Therefore, we present a new data reduction method based on visualization of data in order to analyze the patterns and how data are distributed according to the mean and standard deviation, then divide the graph into small grids and select some samples in each grid. we also propose some data augmentation methods in order to have a diversity of data in a reduced dataset and make a balanced dataset.
III. METHODOLOGY
In this study, we build some training datasets that can be effective for deep learning models to classify printed text data collected in a special environment called PCB. This section describes the preprocessing and sampling methods for training datasets preparation.
Preparing data is a critical step in neural network modeling for complex data analysis and it has an immense impact on the success of a wide variety of complex data analysis, such as data mining and knowledge discovery [23]. Basically, data preparation is about making data set more suitable for machine learning because we may have a large dataset and still run into problems due to its bad quality. The quality of training data determines the performance of machine learning models [14].
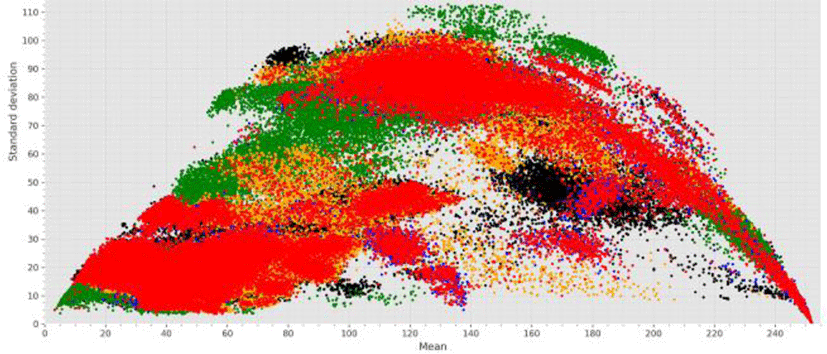
When we visualize the collected data, we realized that some images had been duplicated (or had some translation, rotation, and some noise). Fig. 3 shows the collected data where the color means different production sites where we acquire images, moreover, the distribution of each different color dots shows the results that we cannot train deep learning model using a dataset from just only one site due to be not useful to apply in other sites.
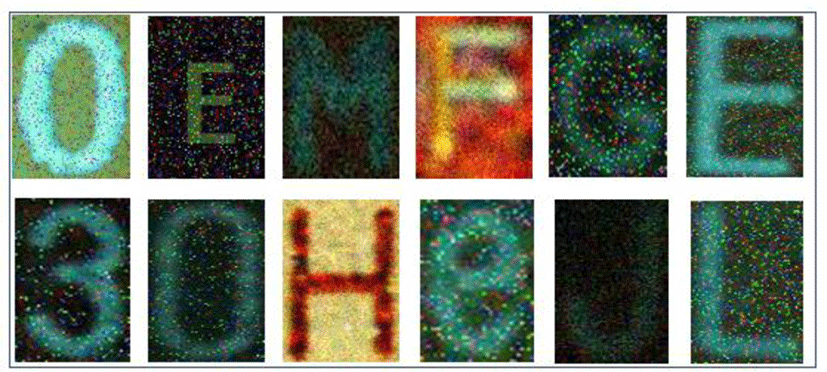
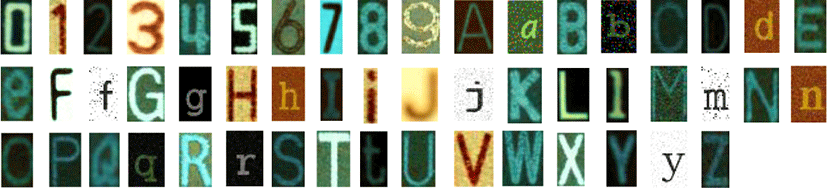
Defining the class for labeling is also included in this preprocessing step. The Class classification should be performed first. The actual number of characters that can be used for PCB components are 10 numbers from 0 to 9, 26 letters from A to Z (uppercase letter), 26 letters from a to z (lowercase letter), 62 characters in total. The case of O and lowercase o, and the case of C and lowercase c in different cases are similar in shape but different in size.
However, it is reasonable to classify them into the same class because deep learning, especially CNN, is robust to rotation, scale, and translation.
The data were constructed as follows. The class for this study consists of 52 classes, lowercase letters that have similar forms to their capital letters are combined into the same class (such as c, k, o, p, s, u, v, w, x, and z), and conversely, letters are separated into different classes if they are completely different types. However, since the data used in this study is obtained from a factory that is in operation, data is collected depending on the type of PCB produced in the factory. Among the received data, the only lowercase data was e, i, t. Therefore, in this study, additional data are generated and used for lowercase classes without any collected data, using some fonts that are generally used on PCB.
Working with limited data has its own challenges, using data augmentation can have positive results only if the augmentation techniques enhance the current data set. The benefits of this data augmentation are to generate more data from limited data and secondly, it prevents the overfitting. Data augmentation is an explicit form of regularization that is also widely used in the training of deep CNN [24].
In this study, we focus on some illumination variations like color inversion and some geometrics transformations like rotation which provide a useful base for further exploring into data augmentation techniques and some image processing functions.
Digital image data is usually encoded as a tensor of dimensions (height, width, color channels). Performing augmentation in the color channels space is another strategy that is very practical to implement.
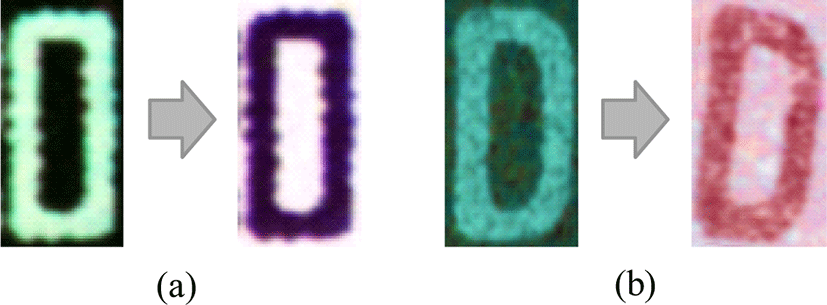
In this stage, we want to generate new data by improving the image quality under different lighting conditions by keeping the image as it was designed. We applied the image color inversion method which converts all the pixel colors and brightness values of the image. As shown in the Figure. 4(a), it appears as if it was converted to a negative because the dark areas of the picture become bright and the bright areas become dark respectively.
Geometric transformations are very good solutions for positional biases present in the training data and in addition to their powerful ability to overcome positional biases, they are also useful because they are easily implemented.
Geometric features variation is a result of variations in the shape, orientation or location of part features. We applied a small random rotation left and right to our data as shows the following Figure 4(b).
Noise injection consists of injecting a matrix of random values usually drawn from Gaussian distribution. Gaussian Noise is a statistical noise having a probability density function equal to normal distribution. Random Gaussian function is added to image function to generate this noise as shows the fig. 5.
Adding noise to images can help CNNs learn more robust features.
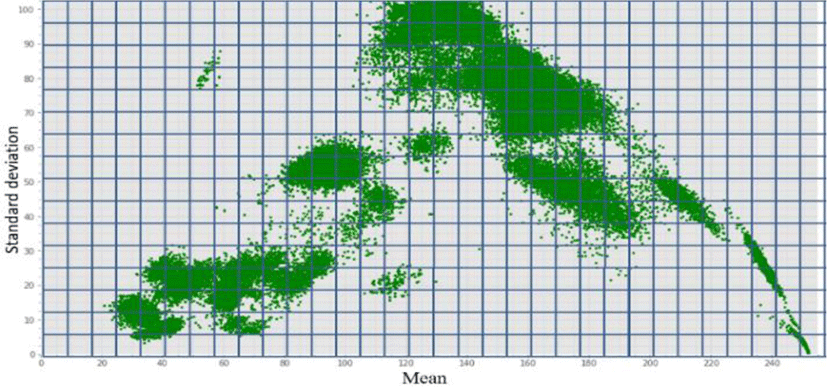
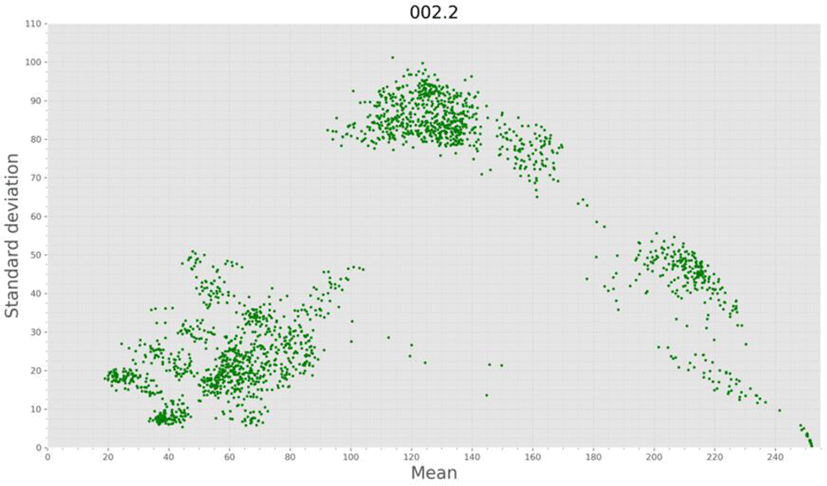
We convert our data based on different colors like RGB color, HSV color, grayscale, and check how these data are distributed based on the mean and standard deviation. Then we create small grid structure on the graph where each rectangular cell is a unit (U) or grid as shown in Figure 6. Each unit represents data with approximatively the same mean and standard deviation. We set n samples representation characteristics of an entire class of N size and compute the percentage of data in each grid according to the n samples to select and compute the reduction rate for each class.
where U are number of grids, N total of data point in every class, n sample data to select.
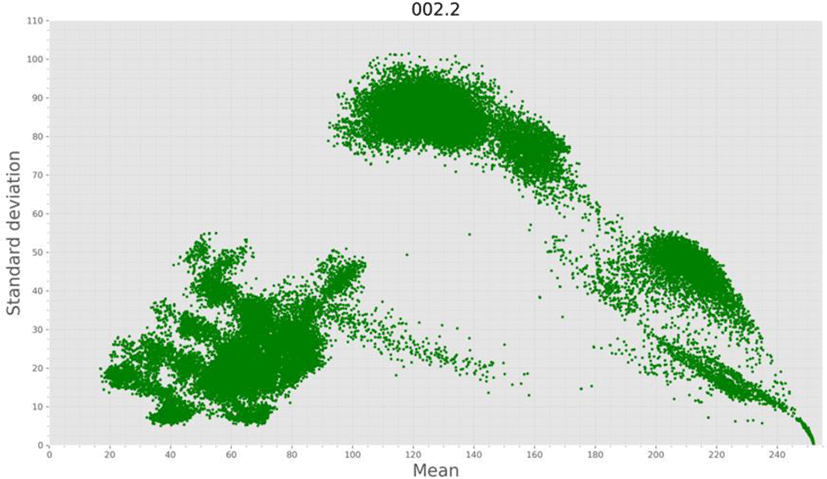
Figure 7 illustrates all data points in class 2 before data processing by any data reduction technique where we have a large number of data point but all these data points are not useful because there are some data point stacks on the same place which is not useful for training dataset while Figure 8 shows the result after data reduction. The original data was reduced to n samples (2000) without losing any relevant information because it keeps the original data distribution.
This section covers our experimental design. We make a comparison between different datasets and their results after training the models. In this paper, we conduct data analysis using a deep learning model through 3 different PCB character datasets collected from 3 kinds of production sites. From these datasets, using data augmentation techniques and some image processing functions, we made a total of 4 training datasets. As shown in Table 1, Dataset 1 includes data from plant 1, Dataset 2 from another plant, Dataset 3 are generated data based on different fonts, like a real PCB environment. Dataset 4 and 5 used the previous datasets by inverting colors or by rotating them slightly. Then the test dataset is a combination of data from several factories, including factory 1 and 2, but collected in different periods of time.
In this study, we conduct two main experiments by using two data sampling techniques which are grid-based algorithm technique(ours) in the first experiment and the Simple Random Sampling techniques in the second experiment, commonly used as an efficient technique for data size reduction. For both experiments, we made a mixture of data in Table 1 and design 5 different datasets with the same parameters, same conditions, and the same environment as shown in Table 2 in order to verify the best method to use when sampling the training dataset for a deep learning model.
| Details | Training | Validation | Test |
|---|---|---|---|
| Dataset 1 | 166,400 | 41,600 |
1)10% images per each class 356,483 2)1000 images per class, 36,000 |
| Dataset 2 | |||
| Dataset 1+2 | |||
| Dataset 1+2+3+4+5 |
During PCB character inspection or character printing, various errors occur rarely, the reason why we consider a total of four problems to solve when building our datasets. Therefore, we constructed the data by considering four types of errors in advance such as illumination variation, geometric features variation, font style, and contaminated data. For the problem of contaminated variance, we added some noises to the images and preprocess them in dataset 3 to 5.
As shown in Table 2, we designed 4 kinds of training datasets which are enough to compare their performance and each of these datasets was designed to compare the effects of each produced or collected dataset. In other words, we mixed datasets and shuffled each dataset in all cases. For some class without data in the test dataset, the test is performed without data in these classes.
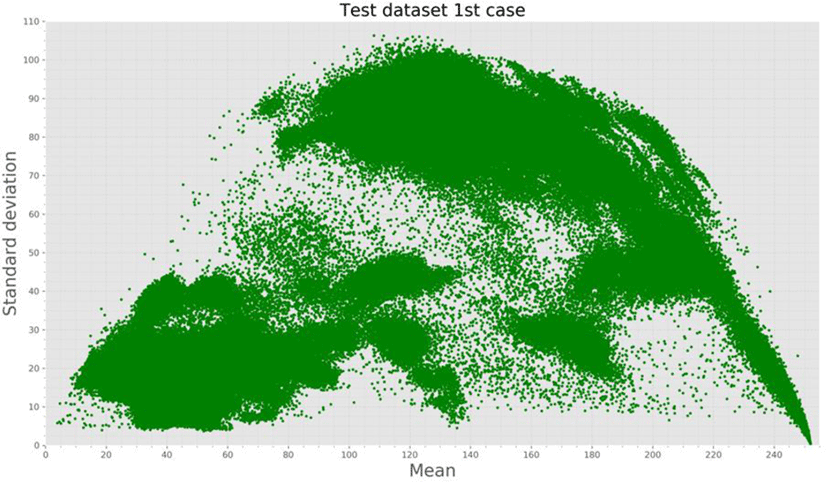
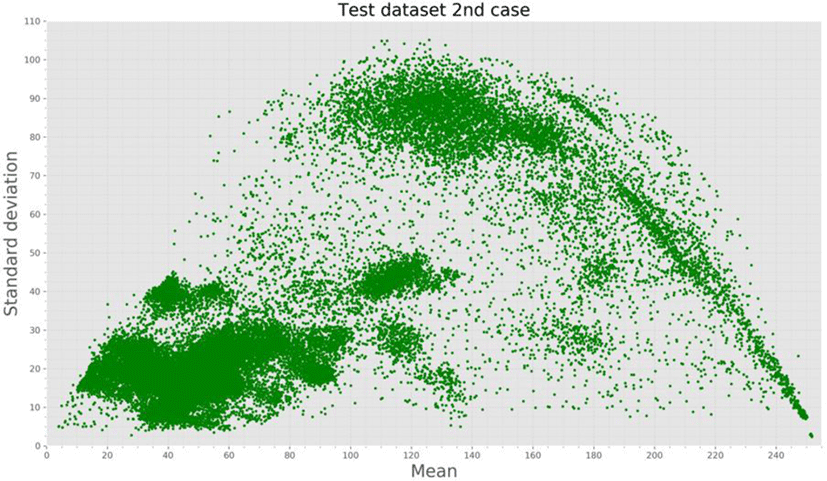
Test dataset includes 2 cases, in the first case, we select 10 percent image samples for each class from the test dataset, and the second case, we select 1000 images per class from the test dataset. Usually, there are some characters that appear often on PCB and other characters appear occasionally. the reason why in the collected data, some class has a lot of data others less. we make 2 test dataset cases in order to compare the effect of test based on the number of data in the real situation (first case) and the effect of testing the model by the same amount of data in every class (second case). In other words, for the first case, the class with more data will have more data in the test dataset as shown the Fig 9.
In all designed 4 training datasets, each class contain 4000 image samples and experiment using ResNet v2 and SENet models, which are one of the most famous CNN architectures for image classification tasks.
We feed the model with a 32×32×3 size as training data. We trained the model for 20 epochs in all experiments which were confirmed that the model converged almost to the loss value. Details experiment contents are as follows:
-
When using only one dataset: we select 1000 samples using our grid-based algorithm then add noise images to be 4000 images per each class for the first experiment and the second experiment, we select 1000 samples using a Simple Random Sample method then add noise images to be 4000 images per class. If there some lowercase classes with no data, 4000 data are taken from dataset 3. These conditions are the same for other mixing cases.
-
Mixing 2 datasets: 1000 images are sampled from each dataset then add noise images.
-
Mixing 3 datasets: 1000 images are sampled from dataset 1 and 2, and 2000 images are selected from the other dataset.
-
Mixing 5 datasets: 1000 images are sampled from each dataset 1 and 2, we pick 650 from dataset 3, 650 from dataset 4, and 700 from dataset 5.
IV. IMPLEMENTATION AND EXPERIMENTAL RESULTS
The experiments were conducted in the environment of Table 3 and Fig 11 shows the details of the database.
We can see from Fig. 12 that the distribution of Dataset 1 and 2 collected on different plants are not the same. The two graphs below show the distribution of sampled dataset with a mixture of 3 datasets and sampled dataset with a mixture of 5 datasets, where a mixture of 5 datasets is the fullest.
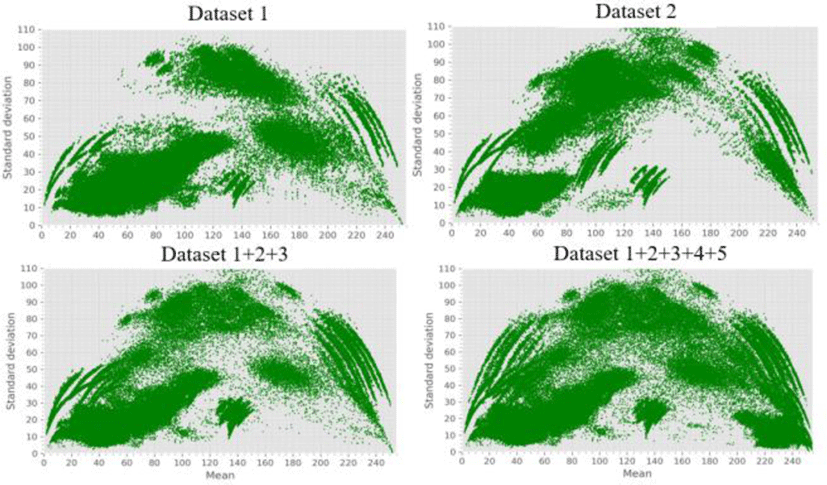
In the graph of each sampled dataset, the upper right part and the upper left part cannot come out from the pixel side, so the distribution of almost semicircle in the graph is the ideal result.
Table 4 shows the results of our first experiment on the ResNet56 v2 model using the first case of the dataset which is 10 percent per class in the test dataset.
| ResNet56 v2 | ||
|---|---|---|
| Random Sampling (SRS) | Grid-based (ours) | |
| Dataset 1 | 87.60% | 84.88% |
| Dataset 2 | 56.10% | 63.45% |
| Dataset 1+2 | 88.60% | 89.11% |
| Dataset 1+2+3 | 88.63% | 95.05% |
| Dataset 1+2+3+4+5 | 78.41% | 84.81% |
In the dataset 2 experiment where the training set data distribution is different from the test dataset distribution, the result is always worst in all experiments. As we can see in Fig 12 and test datasets, the data distribution is different, in dataset 2 there is a presence of new data font style in test dataset which is hard for the model to make a prediction to new fonts style.
In this experiment, the sampled dataset with a mixture of dataset 1 and 2 and the generated images from different font styles shows the best accuracy for the ResNet model. This is because the size of the input image is small, and it is determined that the feature map with higher redundancy is extracted as the layer becomes deeper. Our aim is not just to build a model that can be used in only one factory, but we want to build models that can be flexibly adapted to different environments or PCB production sites.
The following Tables 4 and table 5 are the results of the experiments from different sampled datasets on ResNet and SENet model tested by the first case of the test dataset. In almost all datasets, the trained model using the grid-based algorithm for data sampling shows good accuracy compared to the Simple Random Sampling method. Next tables 6 and 7 show the results from different sampled datasets of ResNet56 v2 and SENet model tested by the second case of test dataset.
| SENet | ||
|---|---|---|
| Random Sampling (SRS) | Grid-based (ours) | |
| Dataset 1 | 89.78% | 92.13% |
| Dataset 2 | 88.10% | 87.43% |
| Dataset 1+2 | 93.81% | 96.80% |
| Dataset 1+2+3 | 92.19% | 88.99% |
| Dataset 1+2+3+4+5 | 91.14% | 91.70% |
| ResNet 56 v2 | ||
|---|---|---|
| Random Sample (SRS) | Grid-based (ours) | |
| Dataset 1 | 84.86% | 81.35% |
| Dataset 2 | 33.83% | 38.57% |
| Dataset 1+2 | 74.51% | 75.51% |
| Dataset 1+2+3 | 86.46% | 90.65% |
| Dataset 1+2+3+4+5 | 63.72% | 76.96% |
| SENet | ||
|---|---|---|
| Random Sample (SRS) | Grid-based (ours) | |
| Dataset 1 | 89.00% | 90.70% |
| Dataset 2 | 83.83% | 82.70% |
| Dataset 1+2 | 93.15% | 94.81% |
| Dataset 1+2+3 | 93.33 | 88.68% |
| Dataset 1+2+3+4+5 | 93.00% | 93.89% |
As SE block [13] can be used with any standard architectures, it is trying to use global information to selectively emphasize informative features and suppress less useful once by trying to add weights to each feature map in the layer.
Therefore, there will be some minutes increments in terms of parameters and computations because of extra layers like Fully Connected and pooling operations respectively. In this study, even though the SENet model is slower in speed than ResNet, it’s showing some good accuracy.
In other words, SENet is too slow to use in the fields of PCB factory because it has a high computational cost and unfortunately, these PCB production sites does not have good environment computers to use deep learning model.
In this section, we also study the usefulness of training data sampling by comparing simple random sampling with our developed grid-based algorithm in order to select good and useful datasets for training a deep learning model. as shown in the results tables, our grid-based algorithm is more efficient for data sampling. In some cases, random sampling also shows good results because it respects the data distribution even it may lose some important information from a large population of data. Tables 4 and 6 which are ResNet56 v2 experiment results on both cases of test datasets, the training datasets sampled using our grid-based algorithm show good performance. On the other hand, tables 5 and 7 show that the results of training datasets sampled using random sampling are also a good method for pick up samples. Brief, the grid-based sampling method is more powerful for small model like ResNet but not always efficient for some complex and power models like SENet.
V. CONCLUSION AND FUTURE WORK
In this paper, we study the feasibility of using sampling techniques for reducing the large size of spatio-temporal datasets. As there are many reducing techniques presented in literature such as sampling, data compression, scaling, etc., most of them are concerned with reducing the dataset size without paying attention to their geographic properties. Hence, we propose to apply a grid-based algorithm technique instead of a Simple Random Sampling method in order to reduce the large size without losing important information. We also conducted a data analysis for a deep learning model through the collected PCB character data.
Generally, in the case of deep learning, good data do not need to be pre-processed a lot before training, when developing PCB parts recognition and character recognition models for commercial use, it is necessary to develop a model that can be used universally by preprocessing without data bias.
The experimental results show that when testing the model on data with a different kind of font style may confuse the model and decrease the model prediction accuracy. To overcome this, we need to train our model on different kinds of font styles because selecting a reasonably small dataset carrying a good amount of information with a balanced dataset can save time and reach a good result. In future work, we will explore more by collecting some defected data obtained after deep learning model tests on real PCB production sites in order to improve our training dataset’s quality.