I. INTRODUCTION
The leading method accepted in practice for recognition and identification of plant diseases is naked eye observation of experts. The capability of decision making of an professional depends on his/her physical condition, i.e. eyesight and fatigue, pressure of work, working conditions such as improper amount of lighting, climate conditions etc. That is why it is not considered as a proper way and also it will consume time. It might be quite costly and expensive as it requires continuous monitoring of experts in large farms. For this main purpose we need a fast method to protect the crop from disease. Detection of rice plant diseases automatically is concluding as an important research topic these days as it will classify and predict the result very quickly.
The classification and prediction of rice crop diseases are the play a major role in technical and economic importance in agricultural Industry. The main diseases of rice plants are Leaf Blast, Sheath Blight, False Smut, Neck Blast, Sheath rot etc. and we discuss it one by one below.
In India, agriculture is considered as one of the main sources of economy. In other aspects, it is also an important source of living for persons belongs to different regions of the country. Rice is the important source of our daily meal, as it provides proteins and carbohydrates with zero amount of fats comprised in it. In addition to this, Rice disease directly and indirectly contributes to the extent of human infectious diseases and environmental mutilation. As the spreading of these diseases over the world affecting damage to the usual functioning of the Rice plant and it also damages the financial, economic and fiscal condition by considerably reducing the quantity of Rice crops grown. The production of Rice crop losses its value due to various types of diseases and the problem with these types of disease is that during the initial phase or stage it is not visible to the farmer by their naked eyes. They predict or estimate the disease by their experience, and we all know it is not the proper way for the detection of disease in crop plant of rice
II. DIFFERENT TYPES OF RICE DISEASES
In initial stages it looks as brown circular to oval type spots on the leaves of rice. Brown spot is spread by airborne spores and it is seed borne. This disease can grow in regions or areas with high relative humidity ranges from 86% to 100% and temperature ranges between 16 to 36°C.The leaves must be wet for about 8 to 24 hours for the infection to occur. Brown spot mostly occurs in nutrient-deficient soil in Fig. 1(a).
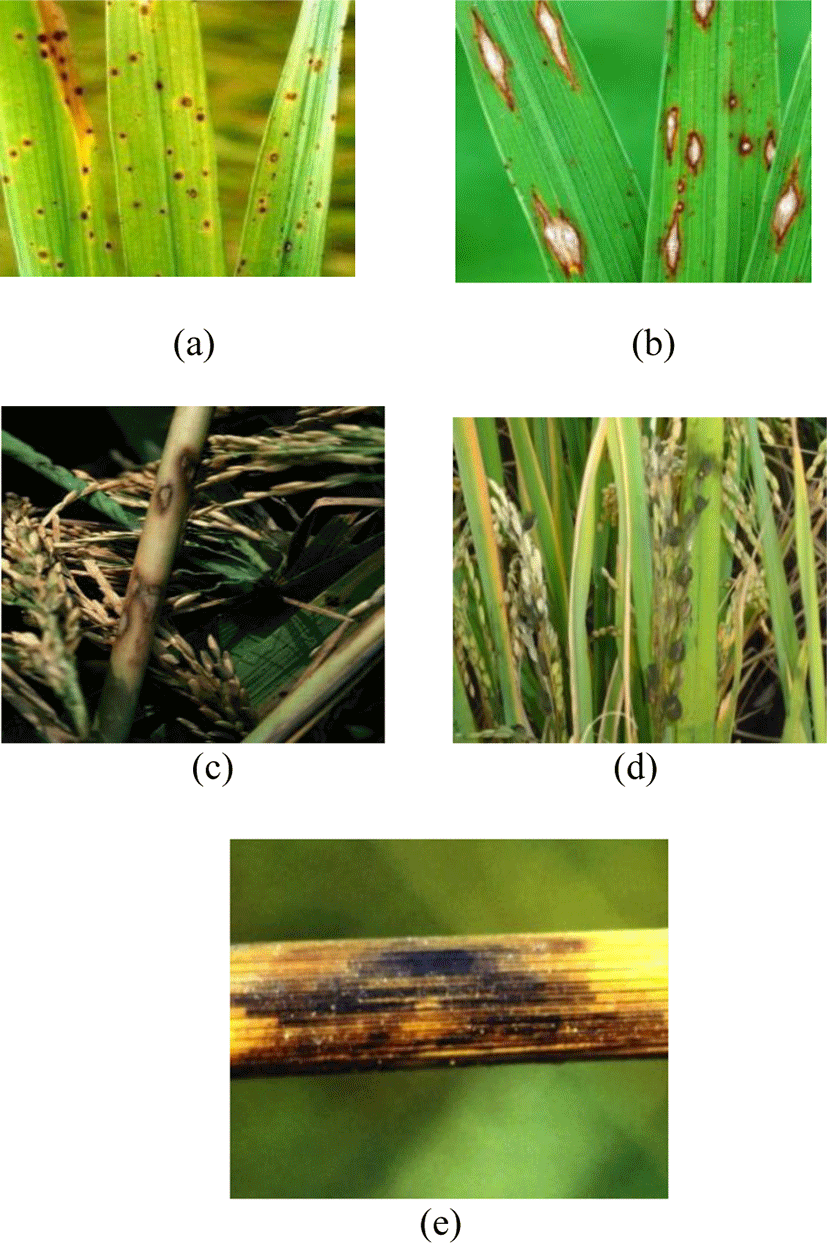
The fungus Magnaportheoryzae is the main cause of this disease. In its initial stages it appears as white to grey-green abrasions or spots with darker borders. Its older Lesions are brown, elliptical shaped and whitish to gray with necrotic border. Its Lesion are wider from center and pointed toward both of their ends. The condition that is favorable to its development are Pest-ridden or diseased seeds, due to shortage of proper amount of H2O in crop, too much usage of nitrogen. Rainy days with high humidity, Fig. 1(b).
The fungal disease Rhizoctoniasolani is the main cause of disease called Sheath Blight. It mostly occurs maximum at digging stage and affects the complete portion of rice plant above water-line. It mostly appears like a snake skin. It is mainly caused by the heavy usage of nitrogenous fertilizers, Fig.1(c).
False smut symptoms are seen only after its flowering. Seed germination of rice crop is also reduced by it. Its pathogen is grown in the ovary and converts it into large, yellowish and soft green balls that become engorged later on. It occurs in areas with very high relative humidity greater than 90% and temperature between 25 to 35 °C. It is Common in hot tropical regions with temperate and cooler hilly areas in Fig. 1(d).
The Fungal Disease Sclerotiumoryzae is the main cause of this disease. It generally appears as Black angular lesions on the leaf sheath at or we can say near water line. Its fungus affects only rice stems and cause lodging in soil. In this leaf small black sclerotic are formed in the tissues of plant mainly after death of the plant.
III.LITERATURE REVIEW
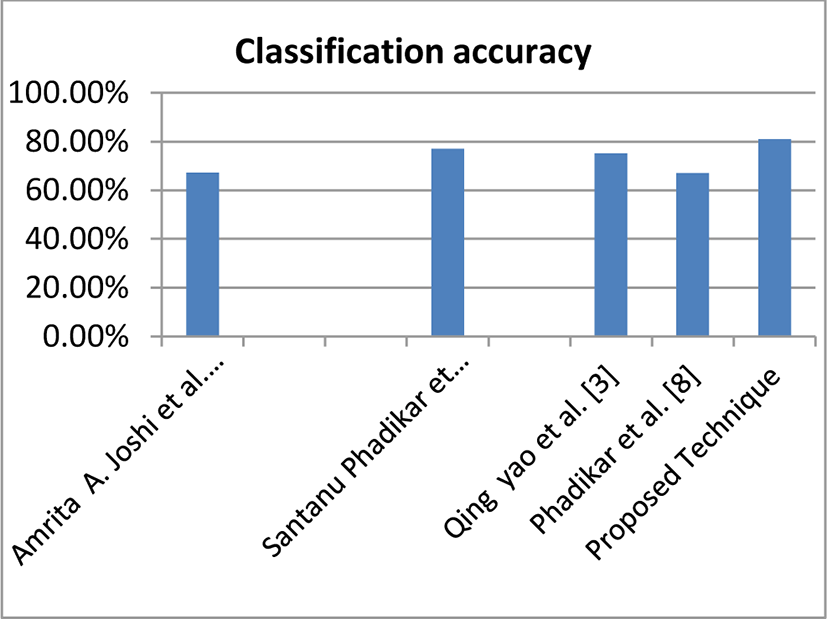
Amrita A. Joshi et al. [10] focused mainly on rice disease like bacterial blight, rice blast, brown spot and sheath Blight. During Feature Extraction, they extract color and shape as feature vector of Diseased Rice Images. All these extracted features are inserted as input to two different classifiers namely Minimum Distance Classifier (MDC) and k-Nearest Neighbor classifier (kNN). For each diseased image a separate database is maintained for the purpose of training and testing. The accuracy between these two classifiers were compared and accuracy obtained by KNN is 87.02 percent and by MDC is 89.23 percent which ultimately shows accuracy of finding disease of MDC is better than KNN.
Santanu Phadikar et al. [4] had investigated the Leaf Blast and Brown Spot diseases occurring in Rice crop. For Extraction of Feature, zooming algorithm was applied using simple computationally efficient technique, in which firstly segmentation of acquired images are enhanced by increasing contrast and brightness and then they apply Boundary detection(8-connectivity) and Spot detection for extracting it as feature vector, For Classification purpose unsupervised learning technique SOM(Self Organizing Map) are applied for testing purposes, which results satisfactory for classification of test images.
Qing Yao et al. [12] focused over Bacterial Blight, Sheath Blight and Blast disease occur in rice. During Segmentation, spots in rice were segmented and then for extraction of features, shape and texture were extracted as feature vector. And then Support Vector machine (SVM) technique was used for classification of diseases in rice. The result shown by using SVM technique for classifying disease spots presents an accuracy of 97.2%.
R. P. Narmadha et al. [1] focused over Blast, Brown spot and Narrow brown spot disease occurs in paddy. During segmentation K-mean algorithm is used to remove noise and unwanted spot which is not required. For extracting feature, feature vectors like Shape and colors are extracted. For classification process SVM, Artificial Neural Network and Fuzzy Classifications are processed.
Sandesh Raut et al. [2] considered leaf and fruit diseases. During segmentation they apply k-mean clustering for partitioning the image into different clusters in which one of the clusters from these obtaining clusters contain major area with diseased portion. In feature extraction Feature vectors like color, texture, morphology and structure were used for statistical texture feature Gray level co-occurrence matrix were used. For classification purposes they used Multi SVM. They conclude combination of both k-mean and multi SVM algorithm consumes less times and provides high accuracy for whole processing
Rajneet Kaur et al. [3] focused over cotton leaf disease detection on the basis of two parameters accuracy and detection time. They perform comparison between two classifiers, SVM and K-Nearest Neighbor and found that SVM is very complex for calculation purpose. It does not perform cost efficient testing for each instance and shows inaccurate results for wrong input. On other side of KNN is effective classifier as compare to SVM and it would reduce the computational cost, they also proved that KNN has high accuracy rate as compare to SVM. Ashwini Awate et al. [13] investigated diseases occurring in various fruits like Grapes, Apple and pomegranate i.e. Black Rot, Powdery Mildew, Downy Mildew, apple rot, Gray Mold etc. For segmentation purpose they use K mean clustering algorithm and features extraction involve texture, color, morphology and structure of hole of fruit as feature vectors by using SURF (Speed Up Robust Feature) algorithm. At final stage classification and pattern matching concept of ANN is used.
Santanu Phadikar et al. [11] focused over rice disease i.e brown spot and leaf blast based on the morphology caused by the diseases. For feature extraction Bayes’ and SVM Classifier are used. The accuracy obtained for Bayes’ and SVM are 79.5% and 68.1%. Pooja Pawar et al. [14] focused over two cucumber crop disease i.e. Powdery mildew, downy mildew. For features extraction texture is involved as feature vectors by using GLCM algorithm and first order statistical moments. Implementation of classification stage involved by using neural network toolbox of Matlab.
Monzurul Islam et al. [15] focused over potato crop disease i.e. early blight and late blight. For features extraction texture and color are involved as feature vectors by using GLCM algorithm. Implementation of Classification stage involved by using supervised learning SVM.
Anthonys G. et al. [16] proposed three rice diseases detection technique, rice blast, rice sheath blight and brown spot. After image acquisition by a digital camera, RGB image was digitized and segmentation of the image was done using mathematical morphology [18]. Features like shape, texture, and color were extracted and used as an input for the classification. Extracted three features were used in a method of membership function to distinguish between the above-mentioned diseases. They achieved over 70% classification accuracy for 50 sample images.
Kurniawati et al. [17] applied segmentation using threshold value to remove the noise they used region filling technique. The shape and color features were extracted using texture analysis and the classification was done using production rule. Cheng et al. [5] presented an automatically seeded region growing algorithm for color image segmentation. YCbCr color space is selected to transform color image. The initial seeds were automatically selected, the color image was segmented into regions where each region corresponds to a seed and region-merging was used to merge similar regions.
Pydipati et al. [6] extracted color texture features of citrus leaves with greasy spot, melanoses, normal and scab to identify the four different classes. Discriminant analysis using textural features in the color co-occurrence method achieved classification accuracies of over 95% for all class Zhao et al. [7] used Bayesian classifier to classify five kinds of maize leaf diseases images. The result shows that the precision of maize disease identifying is higher than 83% and Bayesian classifier was effective for classifying maize diseases.
Huang et al. [8] applied backpropagation neural network classifier and gray level co-occurrence matrix (GLCM) of texture features of the lesion area to detect three diseases of the Phalaenopsis seedling. The accuracy of 89.6% in classifying these lesions was achieved. Tian et al [9] extracted texture, shape and color features of three kinds of grape leaf diseases and studied the recognition accuracy and efficiency of grape disease by Support Vector Machine (SVM) and their results showed that classification performance of Support Vector Machine was better than that of neural networks
IV. PROPOSED METHODOLOGY
The classification and prediction of rice diseases are described in this proposed methodology which involves various application of digital image processing and artificial intelligence based techniques. The proposed system is explained by using block diagram. The steps involved in proposed method consists of digital diseased image of rice plant database collection by using digital camera, then it requires storage process in computer memory for further operation. For the completion of whole process, it requires Matlab software, because Matlab software is best suitable for performing its operation step by step.
Data collection is the primary stage of digital image processing in which we captured the RGB images of diseased rice plant by using camera, from different areas of our state and if it requires we can also collect some of the digital images of diseased rice crops dataset by going to the nearby agriculture university. The formats of digital Images are stored in JPEG format for performing additional operations in Matlab tool.
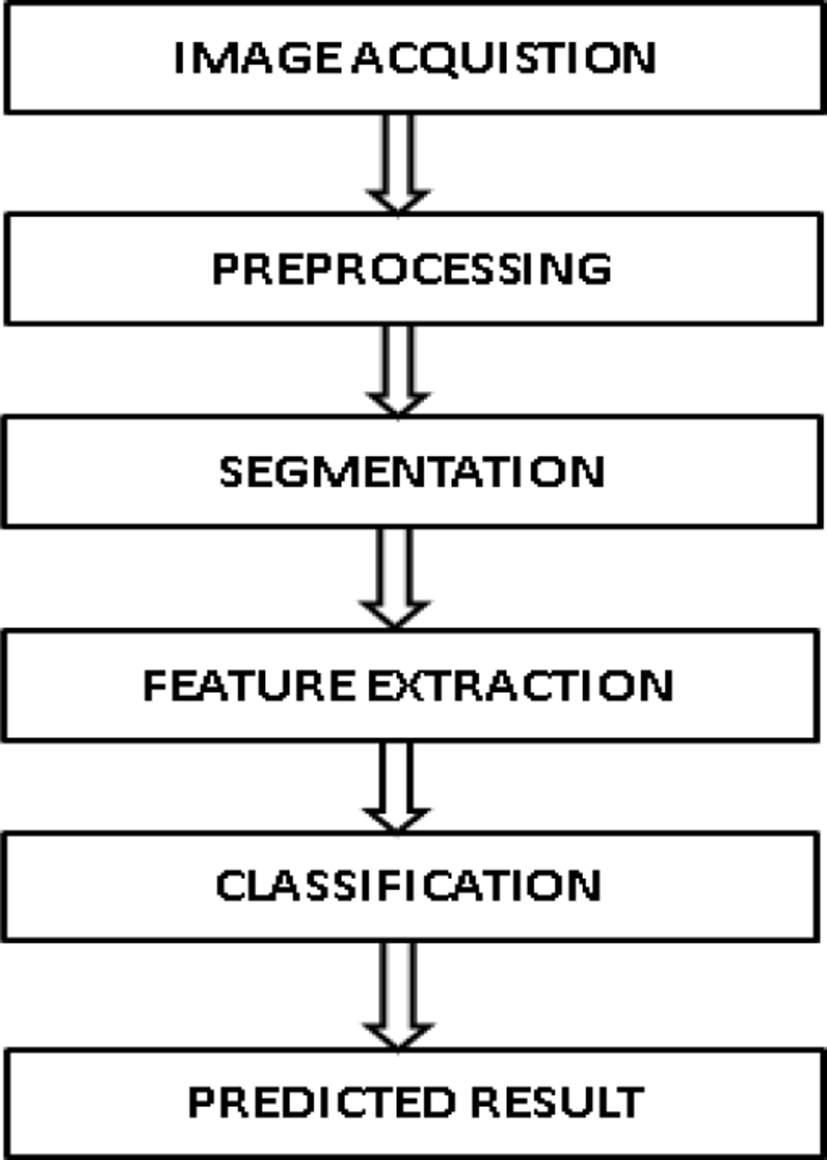
The main objective of preprocessing is to remove unwanted noise, if any found from the digital images that we collected, for carrying out further operations.
The main purpose of the pre-processing and segmentation of digital images of diseased rice plants involves the removal of any type of unwanted noise found in images that we stored in our computer memory for performing next step and the segmentation of digital images has been done by using k-means clustering method, feature extraction using GLCM method and finally the training of system using SVM algorithm. It involves two steps:
In this we change the RGB images of diseased rice leaf into the grayscale images by using function given below.Fig.3b)
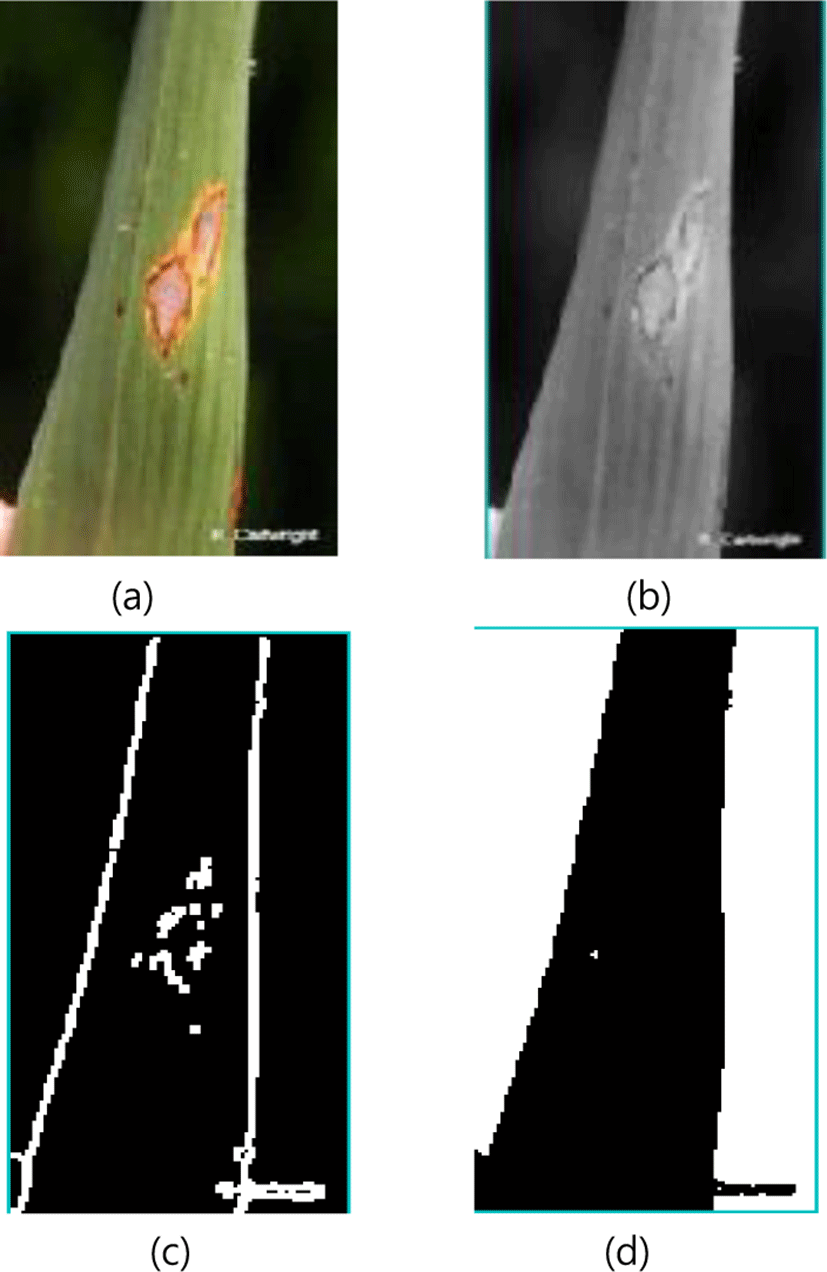
In this stage for filtering the digital images properly we use Median filter because it is generally used for removing noise and smoothing the image for performing further task.
‘Sobel’ operator is used for detecting the edges in horizontal and vertical direction both. Fig.3c)
It consist binary pixels where leaf portion have value “1” that is filled with white color, while background pixel have value “0” that is filled with black color. This is the function we used for it (as shown in Fig.3(d)).
There are four feature vectors i.e. color, texture, morphology and structure are used for extracting the diseased portion of leaves of rice crops and we used SURF (Speed up Robust Feature) algorithm for extracting the features with the help of these four given feature vectors.
There are two classifiers namely MDC and Bayes’ classifier have been used for the classification of diseases in digital images rice crop. Minimum Distance classifier is choosen due to its easy procedure and classified using less time while Bayes’ classifier identifies belongingness of a pattern in a specific class depending on the probability (likelihood) of the pattern with that class and the likelihood (probability) that a ‘x’ pattern belongs to ‘ωi’ class is represented by p(ωi /x). where ‘p(x/ωi)’ is known as the likelihood or Probablity function of class ‘ωi’. MDC is used with Manhattan distance. For training purpose, 70 % of collected digital images are used. For testing purpose and remaining 30% of collected digital image are used. Manhattan distance also termed as ‘cityblock’ distance and we used to denote it as distance (d), between two points A(x1, y1) and B(x2, y2)
V. EXPERIMENTAL RESULT
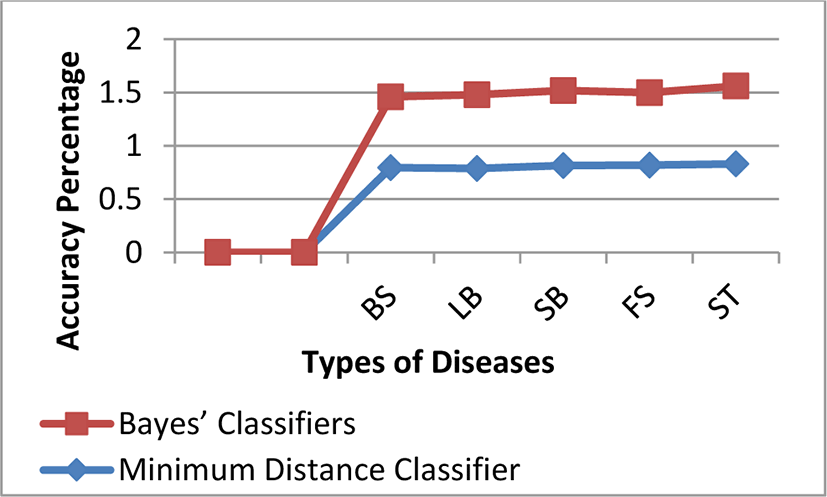
The whole step by step operations used for obtaining the result of Proposed methodology are applied by using MATLAB R2016a, with ‘GUIDE’(Graphical User Interface) that is available in MATLAB tool and testing operation performed on the PC with operating system Windows 10 and i3 intel core processor. The database kept 150 digital images of diseased rice crops, From which 70% of stored digital images are used for training the classifier and 30% of digital images are used for the purpose of testing. Confusion matrix for MDC and Bayes’ Classifier are given in Table II and III respectively, and the classification’s accuracy are obtained from it. Classification accuracy obtained by MDC possessed better result than Bayes’ Classifier. The ratio of a number of correctly classified images over the total number of input images considered is termed as Classification Accuracy.
VI. CONCLUSION
In our proposed work, with the help of Matlab tool we built an interface that we used for detecting five different types of disease in rice crop. During the initial stage, infected or diseased leaves are classified by converting it into gray scale image and then applying median filter over it to remove noise. While during the next level MDC and Bayes’ classifier are applied to detect (classify) the disease portion in leaf of rice by using different feature vectors. We observed that MDC will give higher accuracy than Bayes’ classifier as MDC is very effective classifier as it obtained better result near about 81% while Bayes’ classifier gave approximately 69%.
| Types of disease determined from classifier | Disease types determined from reference source | |||||
|---|---|---|---|---|---|---|
| BS | LB | SB | FS | ST | Total | |
| BS | 37 | 1 | 1 | 0 | 1 | 40 |
| LB | 1 | 38 | 10 | 0 | 40 | |
| SB | 0 | 2 | 37 | 0 | 1 | 40 |
| FS | 20 | 0 | 37 | 1 | 40 | |
| ST | 1 | 0 | 0 | 1 | 38 | 40 |
| Types of disease determined from classifier | Disease types determined from reference source | |||||
|---|---|---|---|---|---|---|
| BS | LB | SB | FS | ST | Total | |
| BS | 36 | 1 | 1 | 2 | 0 | 40 |
| LB | 3 | 34 | 1 | 0 | 2 | 40 |
| SB | 1 | 1 | 35 | 21 | 40 | |
| FS | 2 | 1 | 0 | 37 | 0 | 40 |
| ST | 0 | 0 | 2 | 1 | 37 | 40 |
| Classifiers | Minimum Distance Classifier | Bayes’ Classifiers |
|---|---|---|
| Disease Type | ||
| BS | 79.54% | 66.61% |
| LB | 78.88% | 68.88% |
| SB | 81.61% | 70.30% |
| FS | 82% | 68% |
| ST | 83% | 73% |
| Techniques | Classification accuracy |
|---|---|
| Amrita A. Joshi et al. [10] | 67.23 % |
| SantanuPhadikar et al. [4] | 77% |
| Qing Yao et al. [12] | 75.2% |
| Phadikar et al. [11] | 8.10% |
| Proposed Technique | 81.006% |