I. BACKGROUND
Avian blood pressure can be measured under surgical exposure by a specialist cutting down blood vessels. However, inhalational anesthesia is required to expose the blood vessels in birds and place a catheter in a small blood vessel. This requires a high level of skill and relatively few reports have applied such methods. The presence of the wings instead of arms on birds means that a manchette cannot be anatomically wrapped around the limb for blood pressure measurement, so blood pressure is not easily monitored in birds. In this paper, in an environment under inhalational anesthesia with spontaneous breathing, an esophageal catheter was inserted, blood pressure was estimated from impedance changes in 1-MHz radio waves, and the origin of flow was estimated based on data obtained simultaneously from various multimedia devices.
The following research on data collection using information and communication technology (ICT) for birds has been reported.
In 1963, a 230MHz 3mW 36g transmitter was attached to a pigeon to transmit telemetry [1], and recently, a PHS mobile phone was carried on a crow to try to grasp the behavior in the urban area [2]. In addition, satellite systems are used for the purpose of analyzing migratory bird flyways and monitoring the risk of bird flu.
ARUGOS system with GPS (Global Positioning satellite System) is currently in practical use for investigating the routes of migratory birds. This system is served by polar-orbiting environment satellites of NOAA (National Oceanic and Atmospheric Administration). A radio device attached to the migratory bird is turned on and off intermittently, the passage of the NOAA satellite is calculated from GPS position/time data and the 6 orbital elements of the NOAA meteorological satellite (orbiting satellite). When the NOAA satellite is known to approach, the radio device is turned on and bird ID, position data and a small amount of load data are uplinked to the satellite [3-6]. The smallest transmitter is 3.6 g and can be carried on a migratory bird weighing less than 300 g to follow the flight path [7].
Since the gain over temperature (G/T) of the antenna mounted on the above-mentioned NOAA satellite is a small value, transmission power on the ground cannot be reduced. Data collection is therefore being attempted on the ISS, which can deploy large antennas with lower altitude and higher gain than NOAA. This project, the International Cooperation for Animal Studies in Space, is a joint German-Russian project (ICARUS) that can be used to track wildlife, including small wild birds [8].
The Yamashina Institute for Ornithology in Japan and our research group are recording physiological data from swans using electronic devices such as angular velocity sensors. Specifically, we have developed a terminal that detects the heartbeat and respiratory movements of a swan, records this information in a data logger, and intermittently transmits the data by packet communication (2.4 GHz). We have previously reported these findings in this journal [9-14]. Power is required to monitor and wirelessly send bird physiological data, and we report a subcutaneously implanted device that converts flapping motions into power using magnets and coils. This power-generation element is ten-fold more efficient than the mechanism of electromagnetic power generation in modern wristwatches [15].
In addition, an electrocardiogram is recorded with an esophageal catheter, allowing activity of the sympathetic and parasympathetic nervous systems to be inferred, and analysis of characteristic EMG data in birds such as autonomous muscle contraction is reported.
Some studies have simultaneously recorded air sac pressure between the clavicle and posterior thoracic air-sac, tracheal airflow, and pectoral muscle activity to calculate the effects of muscle strength, or wingbeat cycle, as respiratory functions.
As a specific method, high-speed X-rays of Picapica (Eurasian magpie) flying in a wind tunnel have been performed to evaluate wing beat cycle and air-sac pressure with respect to the relative position of the thoraco-abdominal skeletal structure [16-18]. That study suggested that skeletal deform ation due to flapping and respiratory assistance is associated with changes in air sac pressure [19]. Similar research is also being conducted to determine correlations with air sac pressure by analyzing optical movements instead of X-rays [20].
In vertebrates, individuals infected with avian influenza virus are considered unable to control blood pressure due to the increased permeability of blood vessels due to cytokines released from lesions. In other words, if it is local, the hemodynamics can be controlled as edema / swelling at a specific site, but in the cytokine storm in avian influenza, water leaks out of the blood vessels of the whole body, so blood pressure cannot be controlled.
Grasping the activity of the autonomic nervous system, especially circulatory dynamics, is therefore important. The ability to measure blood pressure with a sensor represents the starting line. Of course, to screen for bird pathologies, such as in poultry, data need to be obtainable from non-contact devices built in a cage, but non-contact devices involve distance between the sensor and heart, so in terms of the signal, noise from surrounding tissues is increased and spatial resolution is decreased. A method of estimating blood pressure from the waveforms obtained by a non-contact device (impedance in a transmitted microwave device) is desired, preferably with a short distance of impedance and various multimedia devices (heart sounds, ECG, air-sac pressure). This is because the origin of the waveform on the impedance can be inferred from the multimedia information of the heart sounds and the ECG.
Since the esophageal catheter is in close proximity to the heart, the spatial resolution is higher than that of non-contact devices outside the body, and if impedance processing of the esophageal catheter is 1 MHz, a 2.4GHz microwave (ISM: Industrial, Scientific and Medical frequency) would be recommended to penetrate the thoracic cavity from outside the body. Our research group believes that even waves can be processed by the same algorithm logically, so a non-contact device in a cage can be used to understand the circulatory dynamics of poultry. If technically non-contact impedance changes can be established, we believe that individual birds infected with the avian influenza virus can be identified at an early stage.
Anatomically, birds do not have the diaphragm that mammals have, and the esophagus of mammals is in the posterior mediastinum, whereas in birds it is in the middle thoracic cavity and borders the left atrium. The lungs of mammals have a dead-end cavity as the alveoli, in contrast, the lungs of birds have a penetrating tubular shape. “Air sac” is connected to the front and back of the lungs. The air that flows into the oral cavity → trachea → lungs → air sac by inspiration and returns in the order of “posterior airsac → recurrent bronchus → lungs → trachea → oral cavity”,so the air passes through the lungs at least twice.
Birds have involuntary and voluntarily controlled skeletal muscles, which have to control multiple air sacs, and the difference in individual air sac pressures makes airflow through the lungs. Skeletal muscles need to be constantly tensioned to gain tension of the air sacs. Therefore, when the ECG electrodes are placed on the body surface, the myoelectric potentials of the skeletal muscles are mixed as noise (Fig. 1). If the noise derived from this myoelectric potential is not reduced, it will cause an error in the accurate heart rate and RR interval (R wave to R wave: cardiac cycle length). Since the RR interval is extremely important for the purpose of grasping the activity of the autonomic nerve system (sympathetic nerve and parasympathetic nerve), we adopted the spatial denoise method. Assuming a circle of 0 to 360 degrees, the myoelectric potential Vsin (t) generated near the circumference becomes zero potential because the phases are added by 0-360 degrees when observed at the center of the circle. Based on this principle, the noise from the muscles generated in the thoracic wall becomes extremely small in the esophagus. This method is spatial denoise, so we prototyped a catheter for taking an electrocardiogram from the esophagus of birds [21,22]. This study incorporates an angular velocity sensor, microphone, and impedance loading technique [23,24] into this catheter.
II. METHODS
Impedance is a complex number, with the following imaginary part:
Here, ω= 2 πf and L=0 in the living body, so Z (impedance) depends on C (capacitance).
If L represents distance to the metal plate, S is the area of the metal plate, permittivity is ∊_0, and relative permittivity is ∊_s:
Here, assuming that S and L are fixed by the measuring instrument, changes in C can be seen to depend on the relative permittivity ∊_s; that is, the movement of the dielectric in the bloodstream. The imaginary number for impedance is the phase. The change in the permittivity in the blood vessel can be obtained as a change in the phase of impedance by changing the C of the circuit being measured.
A bedside (human) continuous patient monitor (for example DS-8600 Fukuda Denshi, Tokyo) is also used as a monitor for small animals, and the respiratory monitor mounted on it measures impedance of the thorax using the electrocardiographic electrodes on the chest wall. Impedance is designed mainly for the purpose of detecting movement of the thorax.
The specific method involves oscillation at a low frequency of about 40 kHz, loading this signal on the chest wall via a serial resistor for DC current detection and an electrocardiogram electrode. At the same time a synchronization signal is received from the oscillation circuit. Using an analog switching element, a kind of synchronous detection can be performed by measuring the high-frequency potential between the electrocardiogram electrodes at a certain timing.
As a condition, if the output power of 40 kHz is constant, Ohm’s law clearly indicates that the voltage of the serial resistors for current detection changes due to impedance changes in the chest wall accompanying movements of the thorax.
Since the timing is fixed, only the high-frequency voltage (amplitude) is measured.
If a load signal such as IQ complex plane) is shifted by 90 degrees in one cycle, if measurements are made at the timing of each orthogonality, a voltage that maintains the two orthogonal relationships can be obtained. In reality, such circuits are not built into commercial equipment. This is because the movement of the thorax can be sufficiently diagnosed only by the amplitude. In other words, cardiac output cannot be obtained as an impedance change using any commercially available patient monitoring device.
Here, to emphasize the timelines, I/Q separation is not used, and AM (Amplitude modulation) synchronous detection is adopted to allow extremely simple processing. Generally, in the heterodyne method, the modulated signal can be beatdown directly to the baseband by making the local oscillation frequency the same as the carrier wave, which is a kind of synchronous detection method, also called the zero IF (Internal Frequency ) method. The 1-MHz signal is considered to have undergone amplitude modulation in the heart (blood flow) between the two electrodes (between +1 rode and +2 rode). The unmodulated signal is the locally transmitted signal, while the modulated signal is the received signal. In this case, digital signal processing can be reduced to find the difference in amplitude and phase difference between the two signals.
Specifically, analog processing is used to obtain results in near real time, as follows:
-
Amplitude is obtained by subtracting two waves and passing the carrier signal through a multi-stage low-frequency filter to obtain the absolute value of the amplitude as an envelope.
-
Phase difference is obtained by subtracting two waves to form a beat signal, and this frequency is converted into an electric potential (F/V: frequency voltage conversion).
-
Notably, the S/N (signal over noise) of the output signal is better when the signal strengths of the two waves are the same. Loads with unbalanced signal source connections, such as Minnesota impedance, are unsuitable for AM synchronous detection.
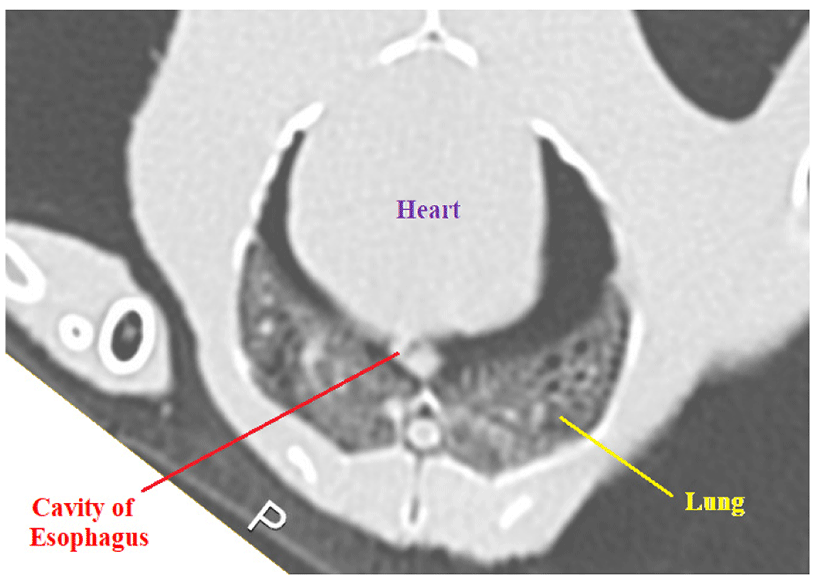
The mammalian esophagus is located in the posterior mediastinum of the chest, while the avian esophagus runs in the mid-mediastinum such that it touches the back of the heart, as can be seen from the CT-Scan image in Fig. 2. We therefore thought that impedance measurement using an esophageal catheter would strongly reflect blood flow in the heart.
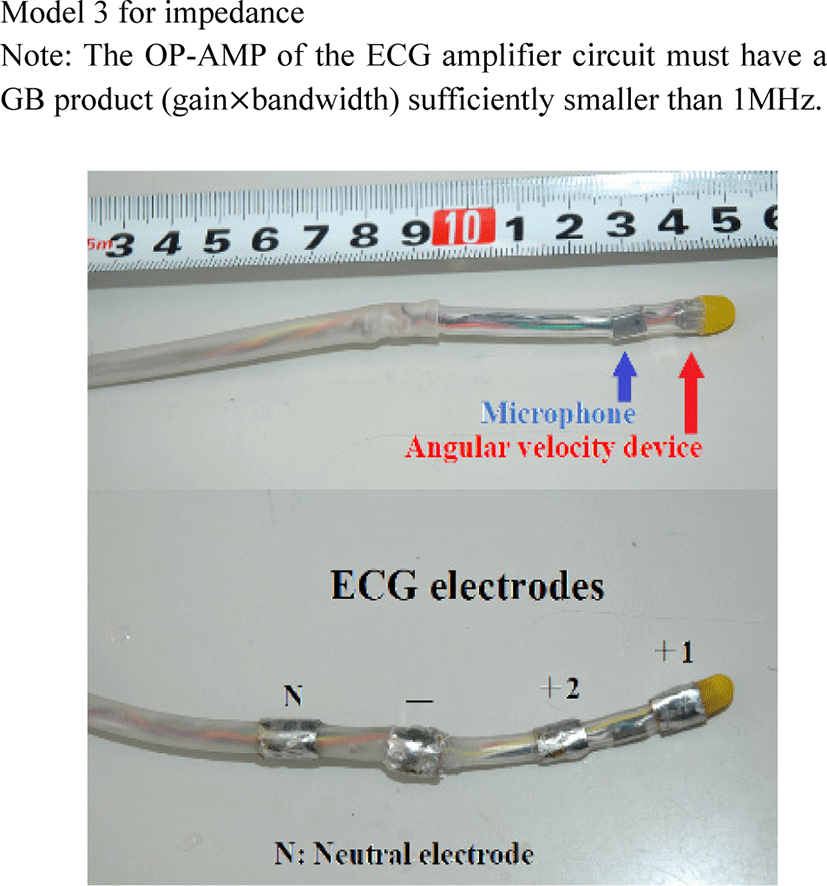
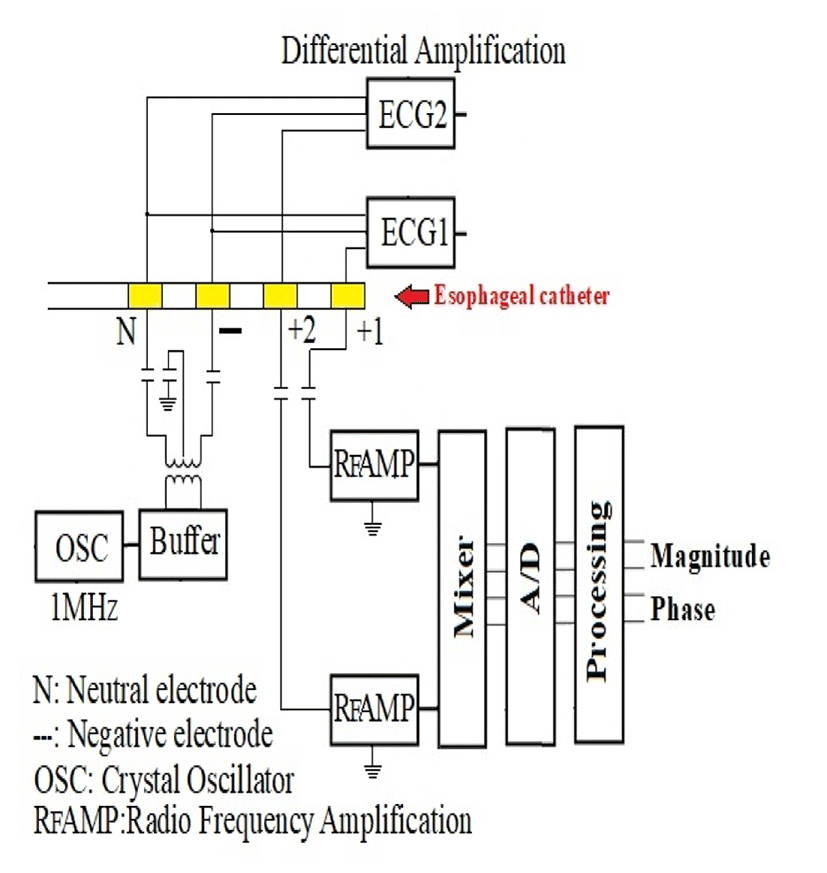
Esophageal catheters have already been developed to record electrocardiograms, and the electrodes for electrocardiography are loaded with MW(Mediumwave) radio frequency. The developed flexible esophageal catheter (Model 3) is shown in Fig. 3, and the block diagram related to the electrodes of the catheter is shown in Fig. 4. An angular velocity device is installed at the tip of the esophageal catheter, and a small microphone is incorporated 1 cm toward the mouth. The spacing between the two devices is 10 mm (specifications are summarized in Table 1).
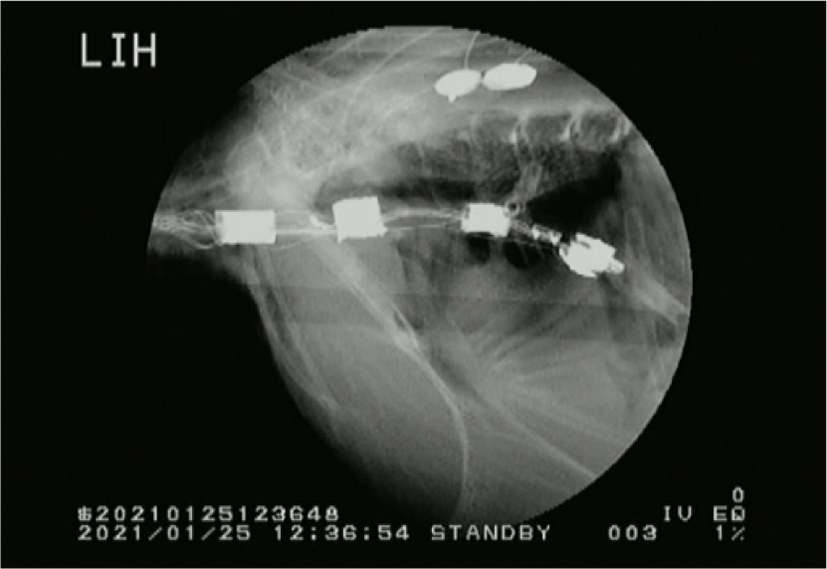
The depth of the catheter can be estimated from the difference in the QRS complex of two ECGs (ECG1 and ECG2). However, in the case of chickens, the catheter must be passed through the crop, so we use an X-ray fluoroscope to manipulate the catheter with a finger from outside the neck, and advance the catheter to the lower esophagus, so the position can be confirmed with the naked eye under fluoroscopy.
To measure impedance, with loaded frequency 1 MHz in the middle wave band, an output power of 0 dBm (1 mW) is applied between the neutral electrode and the negative electrode of ECG, and the impedance change between the adjacent atrial electrode and ventricular electrode (magnitude, phase) is calculated. As mentioned above, in pursuit of real-time performance and to simplify arithmetic processing, directionality (positive/negative discrimination) is not arithmetically processed, and only the absolute value of the difference in magnitude and the difference in phase are processed.
III. VERIFICATION
Ten chickens (body weight, 820–1290 g) were used in the experiment. These animals were of arrhythmia-free pedigree and were purchased from the Nippon Institute for Biological Science (Ome, Tokyo, Japan). Inhalational anesthesia was induced to maintain spontaneous breathing with isoflurane (mean, 2.5%).
The chicken’s esophagus has crop, so a catheter inserted through the oral cavity wraps around the crop and does not reach the lower esophagus. Therefore, an X-ray fluoroscopy device is used to guide the tip of the catheter to the lower esophagus from the surface of the chicken’s neck with the operator’s finger. The depth of the catheter can be grasped by comparing the two ECG waveforms, or can be visually confirmed by using an X-ray device (Fig. 5).
After inserting the esophageal catheter, an endotracheal tube (size 3.0–3.5) was inserted into the main trachea, and airflow corresponding to expiratory pressure was measured by a pressure sensor according to Bernoulli’s principle for the purpose of monitoring respiration. Furthermore, a tube with an inner diameter of 2 mm connected to a pressure sensor was inserted into the precordial air sac and fixed to the skin with silk thread to determine changes in air sac pressure around the heart.
The axillary artery was cut down to obtain continuous open blood pressure, and a tube used for hydrocephalus (P10 in size) connected to the pressure sensor was placed in the artery and fixed to the skin with nylon thread.
The inside of the P10 is filled with heparin saline to prevent coagulation. All time sequence data were sampled in 500-s intervals and voltage resolution 16 bits was recorded by A/D converter (32 ch, 16 bits DIO-3216 LX-USB made by CONTC, Nagoya), import to PC via USB. The data were analyzed by VBA of Excel on a personal computer (Windows 10).
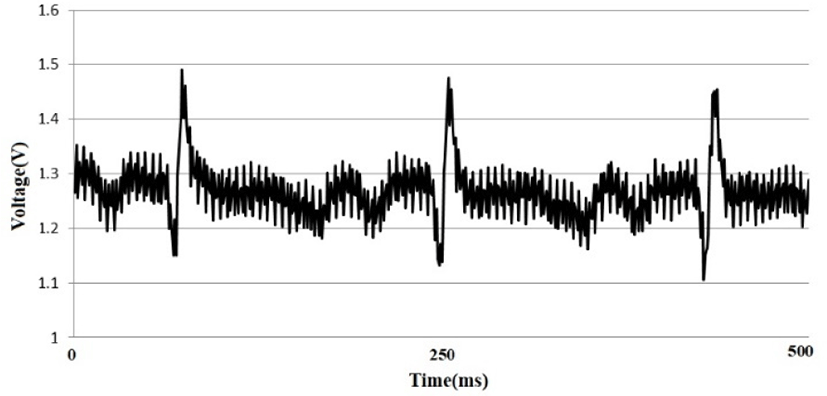
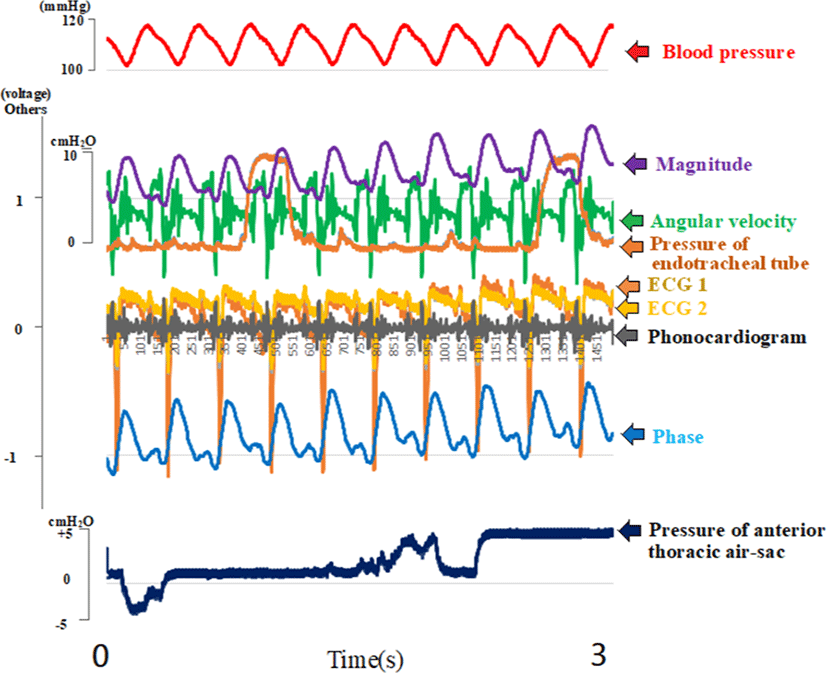
Each waveform obtained is shown in Fig. 6. In this study, the main aim was to clarify the correlation between impedance (particularly phase) and axillary artery pressure, and the correlation between these two during systole was found (Fig. 7). The blood pressure waveform has to shift the propagation time (delay time) from the heart to the axilla, 26/500 s (52 ms), and further convolves the delay from the tension received from the blood vessel coefficient such as:
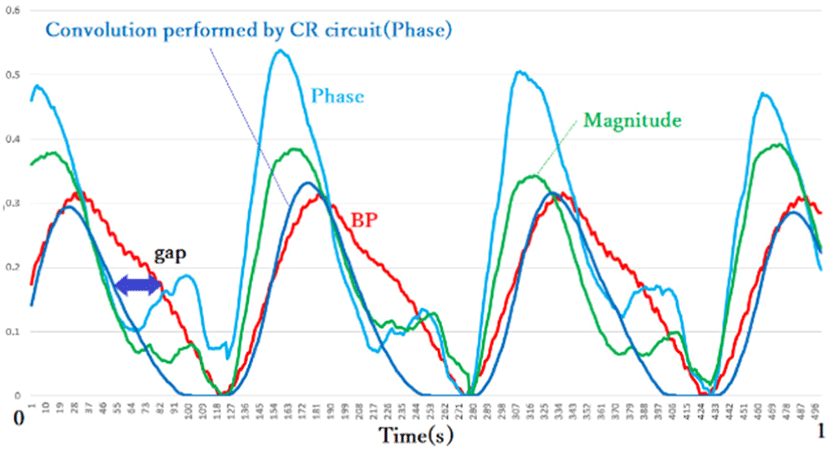
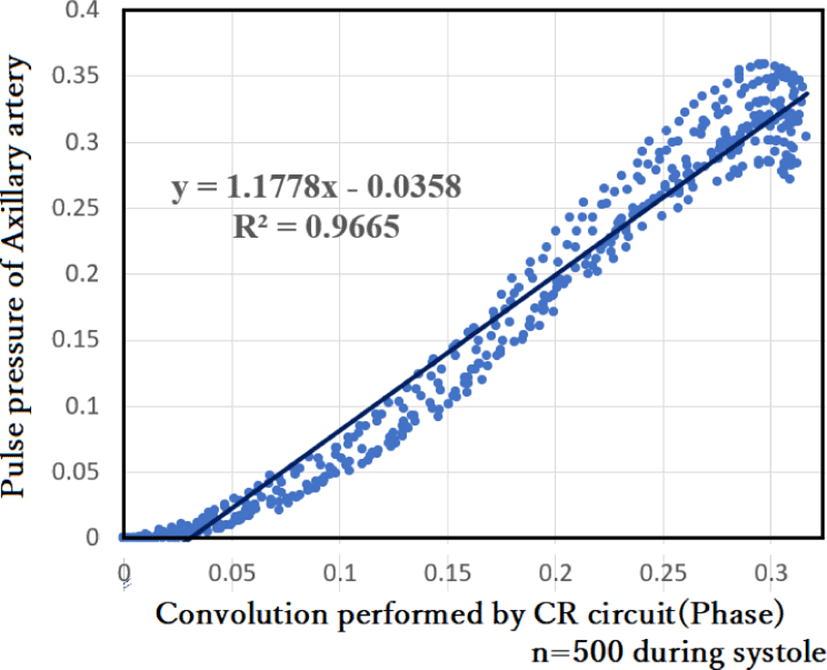
The waveform loaded with this convolution integral and the axillary artery have a strong correlation (coefficient of determination, R2 = 0.9665 from early systole to peak) (Fig. 8). Since this high correlation was obtained in all 10 chickens tested, impedance (phase) can be estimated for blood pressure (maximum blood pressure / minimum blood pressure), at least from the beginning of systole (minimum) to peak systole(maximum).
The units of axillary artery pressure and impedance (phase) differ, and can be drawn as shown in Fig. 8 when normalized. Also in this figure, for synchronization with the start of systole, the delay of 26/500 s, corresponding to the distance from the heart to the axilla, is drawn ahead of schedule on the blood pressure side, and the delay in diastole of arterial pressure (Fig. 9). Furthermore, the second wave of impedance is a waveform from around the heart that is not seen in the peripheral artery, and records some blood flow. In the second wave, you can see a high wave that shows the excitement of each small segment. The small-amplitude modulation of arterial pressure is due to the autonomous contraction of skeletal muscle (excitation of autonomic nerves such as warrior tremors), which is essential for maintaining the air sac and is characteristic of birds. This has been reported in the Journal of Multimedia Information System [21].
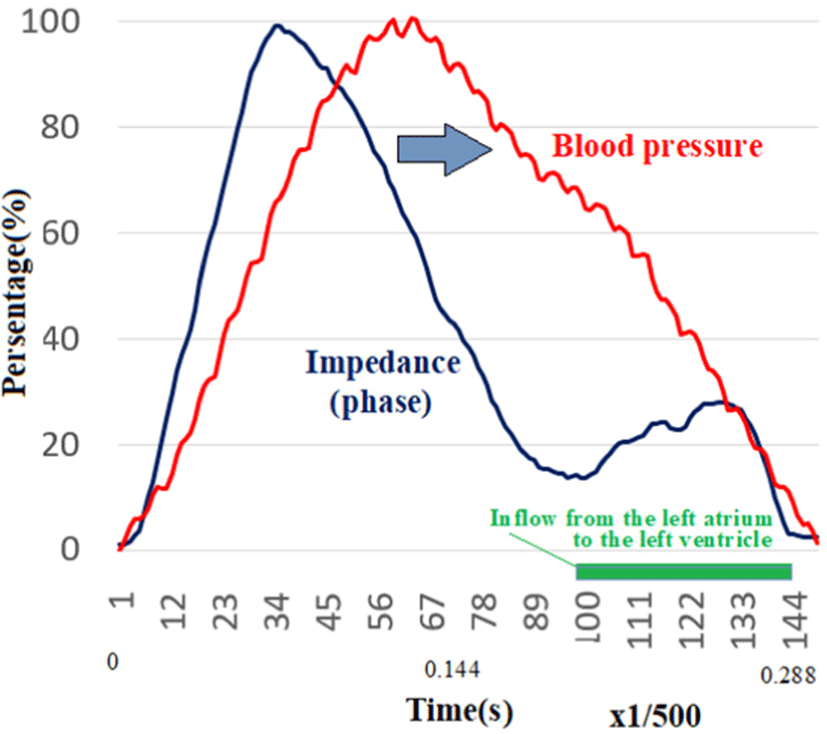
By comparing normalized waveforms, convolution from the tension of the vessel wall and its CR coefficient can be calculated back. The normalized waveform also strongly suggests a mutual correlation between impedance (phase) and axillary artery pressure during systole.
IV. CONSIDERATIONS
Since an ultra-small microphone was installed inside the catheter and heart sounds were recordable near the heart, we tried to estimate the correlation between heart sounds and the phase of impedance, particularly the second wave of the phase. The catheter is located on the dorsal side of the heart, and the main source of heart sounds can therefore be considered to be the sounds from the left atrium and left ventricle.
If defined as (Fig. 10), blood flow from the left atrium to the left ventricle between “time mark 1” and “time mark 2” of the angular velocity, Phase, and Phonocardiogram.
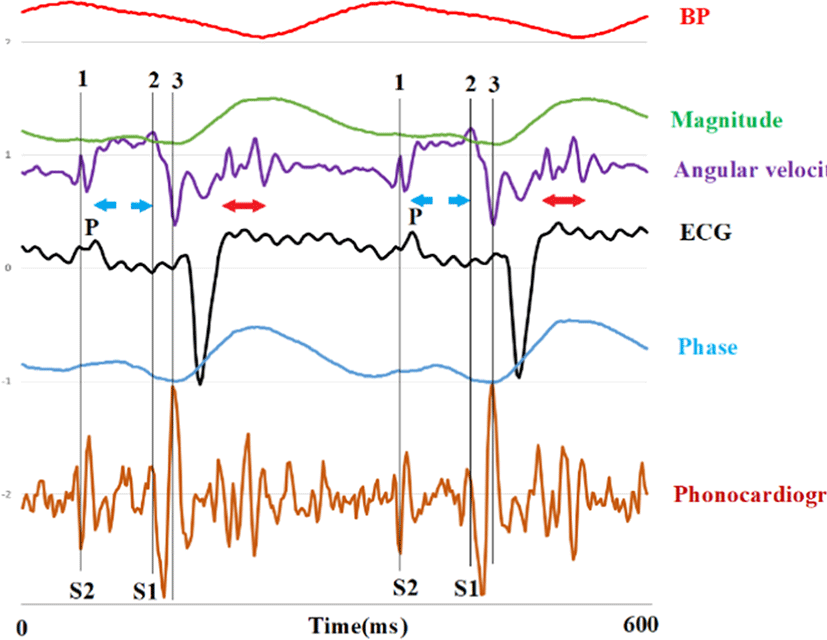
Between “time mark 2” and “time mark 3”, pressure is parallel and the mitral valve closes that can be suggested by physiological procedures.
The second wave of the phase with “time mark 1 to 3” can be seen to be almost synchronized, but since the second wave started even before “time mark 1”, the left atrium before the aortic valve is closed.
Super-early movement is likely preparing for contraction. In the future, visual confirmation of the movement of S2 and left atrium contraction by ultrasonic echography will be necessary.
Notably, the direction of blood flow is not physically determined by radio waves (or radio frequency), but by acoustic waves, which is more accurate. For example, Doppler echography will be possible to determine blood flow in blood vessels with rumble and turbulence in the ventricles. If the frequency can be increased and penetrated through the skin, the radio waves used here have the only merit of allowing non-contact measurement. Because hardware and processing are simplified, real-time processing is achieved, but the phase difference is expressed as an absolute value. Even this condition, when we apply a linear waveform by conversion, the calculated line can approximate the actual blood pressure.
Twenty billion poultry (chickens, quails, ducks, pheasants, etc.) are bred on the earth, and the market size is estimated as 120 billion dollars annually. On the other hand, influenza strains (H1, H2, H3) that caused global pandemics in the past were found to have been directly transmitted to humans from avian viruses without going through pigs, according to a survey by the American Disease Association and others [22-29]. The 2009 swine flu outbreak did not lead to a pandemic, and showed almost the same mortality rate as seasonal influenza. Monitoring of poultry appears indispensable in the future.
Cytokine storm involves a large amount of cytokines (interleukin-1, interleukin-6, tumor necrosis factor-α, etc.) released into the blood from mast cells, etc., so plasma leaks from blood vessels via the blood vessel walls, and sympathetic nerves continue to be excited in an attempt to maintain blood pressure. The release of large amounts of adrenaline increases blood pressure, resulting in tachycardia. However, adrenaline is eventually consumed and blood pressure cannot be maintained. Therefore, the blood pressure rises at the beginning, but after the consumption of adrenaline, the blood pressure drops even though it is tachycardia, and the activity of the whole body also decreases. Therefore, it is important to detect “temporal fluctuations in blood pressure” and “persistent tachycardia”.
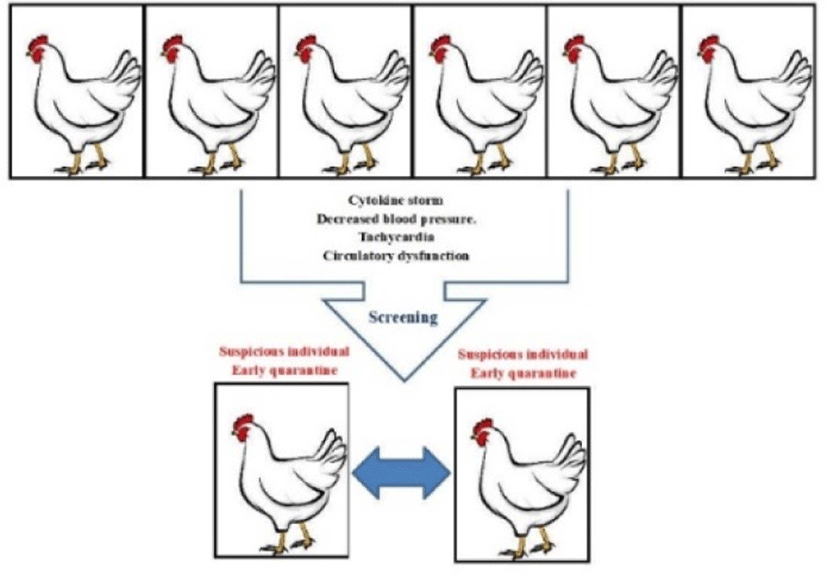
In poultry, an esophageal catheter cannot be swallowed, so we believe that tachycardia can be measured and decreases in blood pressure seen with cytokine storms can be identified by non-contact measurements from a device installed in a cage. The principle of impedance amplitude and phase change and the detection algorithm are the same regardless of the carrier frequency. However, attenuation and spatial resolution undeniably decrease with distance from the heart. No problems are encountered in detecting the pulse rate, but the accuracy of blood pressure is estimated to include some error. However, we think that blood pressure can be detected sufficiently, because blood pressure is markedly lowered in the cytokine storm. In the near future, we aim to develop non-contact impedance measurement using microwaves (Fig. 11) and experiments involving quails and chickens.
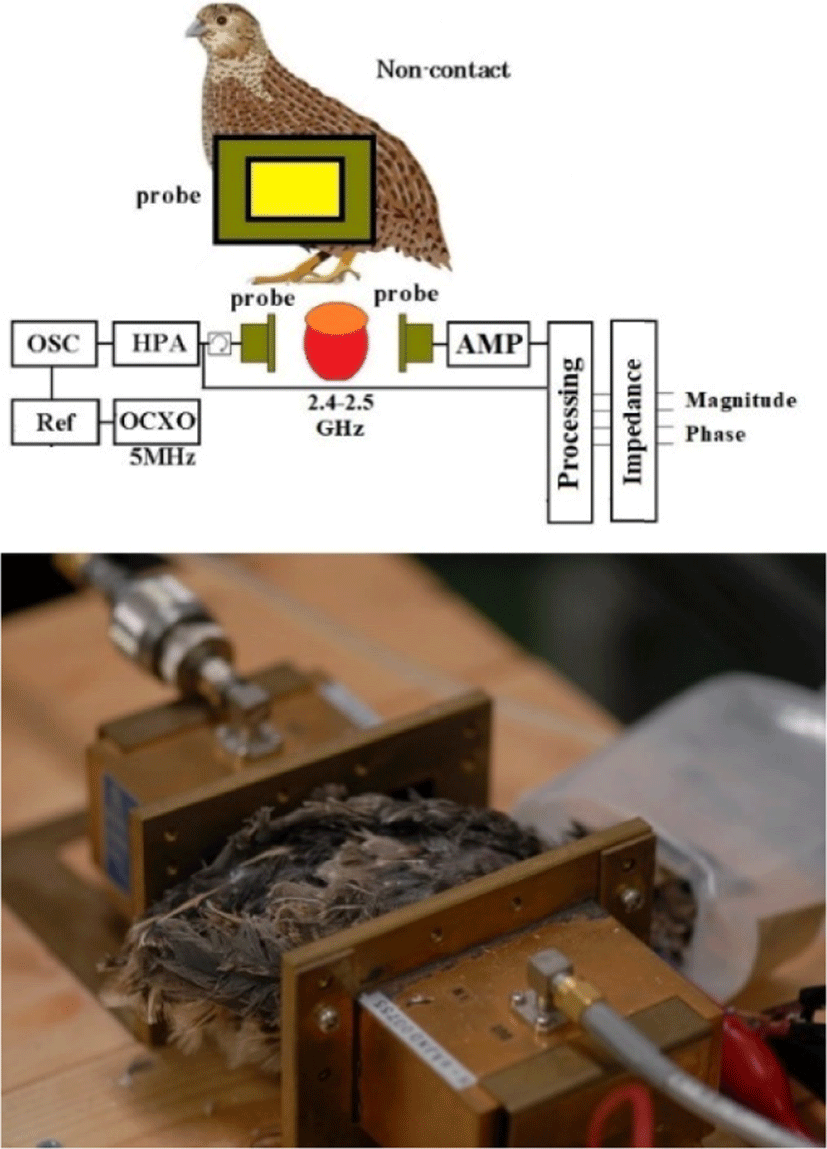
Radio waves that pass through (penetrate/attenuate/block) the living body have frequency characteristics depending on the properties of the tissue. At a relatively low frequency, such as 2.4 GHz, it passes through the heart and skeletal muscles, but above 5GHz, the high impedance skin reflects most of its energy. Therefore, it is possible to detect the fleshy quality of the broiler, especially myopathy, which has no commercial value, using low frequencies, while at high frequencies (10-24 GHz) are tested to detect the vibration of skin to analyzed reflected radio waves from the skin that vibrates with the energy of heartbeat [30,31].
It is also performed to analyze and measure the heart rate. Birds have feathers and this method is not very effective, but there is a move to put it to practical clinical use in the future for non-contact measurement of patients sleeping on the bed [32-36].
We have studied on a wireless data logger on the whooper swan and aim to reduce the size of the 2.4 GHz impedance device. We aim to assemble this impedance device on the swan’s piggy back. In future, it will be possible to grasp the blood pressure and RR intervals of flying birds, and it will be possible to screen individuals infected with the avian influenza virus outdoors.
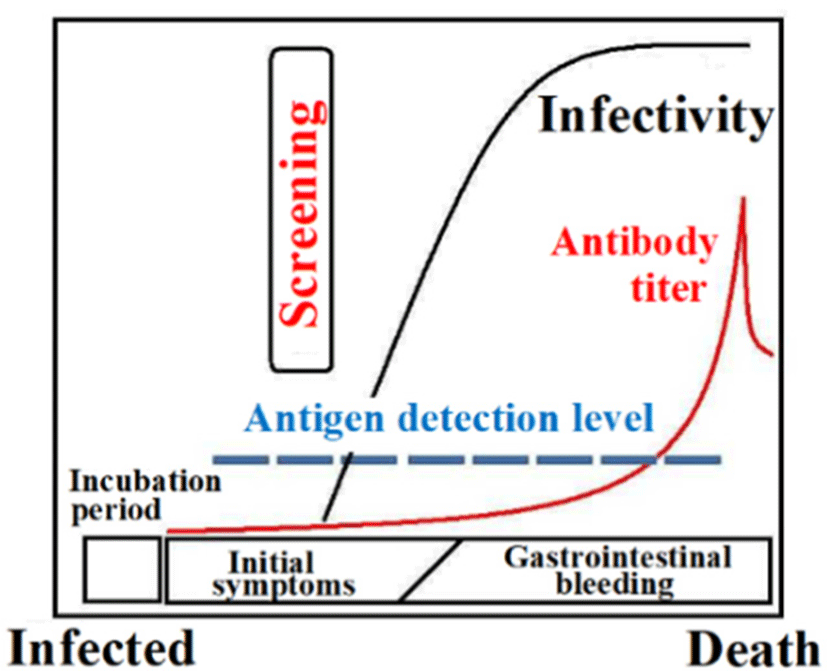
In poultry, if even one bird dies from bird flu in a poultry farm, measures are currently being taken to slaughter the entire flock. As shown in Fig. 12, the dying individual in the terminal stage shows high infectivity, and has increased antibody levels. We are aiming to pay attention to non-contact determination of hemodynamic abnormalities that occur in the early stage of cytokine storm, isolation of suspicious individuals, and prevention of infection in other individuals. If a different disease is detected, such as Newcastle disease, treatment can be provided. If a healthy individual is accidentally isolated, the individual can be returned to the population at a later date, rather than killing the entire flock. Why would the flock be killed if a healthy individual is accidentally isolated? With scientific tools, you won’t kill an individual in vain,
This approach (Fig. 13) is clearly overwhelmingly economically superior. We consider this method to represent one of the technological elements that can protect the flock from slaughter in the future.
V. CONCLUSIONS
When a medium wave of 1 MHz is applied to the flexible esophageal catheter that we have already developed to record electrocardiograms from chickens, the impedance (phase) between the electrodes of the atriosphere and ventricle can be obtained. In particular, phase reflects blood flow, which is a dielectric, and we confirmed a strong linear correlation between changes in systole from the heart and waveforms of the axillary artery.
The experimental results accurately match the heart sounds collected by multimedia, especially the valve closing sounds, the timing of the R wave on the electrocardiogram, and the movement of the angular velocity sensor (vibration from the left ventricle). Currently, the impedance changes at a position close to the left atrium, and the carrier frequency is as low as 1 MHz. In the future, if we measure from outside the body in a non-contact manner using a carrier frequency of 2.4 GHz, we have already obtained a waveform of impedance in the vicinity, so we think that it will be possible to detect a similar waveform buried in noise. This is because the phase-modulated waveforms are logically the same regardless of the carrier frequency.
In the case of poultry, output from the heart may be possible to estimate in a non-contact manner using microwave antennas built into both sides of the cage. This device may be applicable in the future for screening individuals infected with avian influenza virus and exhibiting cytokine storms.