


I. INTRODUCTION
Electromagnetic (EM) field probes are used in the measurement of electromagnetic compatibility (EMC) testing. To ensure that the measurements are reliable, the EM field probes must be calibrated. The conventional EM field probes calibration methods are defined in terms of theoretical and experimental models of EM field generation [1-4]. Using standard gain horn antennas to establish a standard field inside an anechoic chamber is one of the most widely used methods for calibrating probes for IEC61000-4-3 applications [5]. Also, the standard IEC61000-4-20 [6] provides the procedure for carrying out the calibration by using the transverse electromagnetic (TEM) cell.
However, the EM field probe calibration results may show differences when the probe is calibrated in different environments. Therefore the environment and method for an EM field probe calibration are very important. In that sense, the TEM cell has become popular test apparatus to calibrate the EM field probes. Because the TEM cell, which is isolated from outside electromagnetic waves, can provide TEM mode wave with specified electric and magnetic field strengths [7-14].
The IEC61000-4-20 is to be describing verification methods of the TEM cell for EMC tests. The measurement information is taken into account by the statistical approach, which is Normal distribution. The TEM mode is taken into account as dominant, if statistically at least 75 % of the measured secondary components are at least 6 dB smaller than the primary components of the field. The statistical description of the ratio of secondary and primary field component is based on the assumption of a normal distribution. However, this normal distribution is not applicable for the verification of TEM mode.
In this paper, the verification of TEM mode with the statistical approach in TEM cell is suggested. We present various statistical distributions of electromagnetic fields in a four-port TEM cell.
This paper is organized as follow. In section II, this paper explains the TEM mode verification for each mode. Section III concludes this paper.
II. TEM MODE VERIFICATION
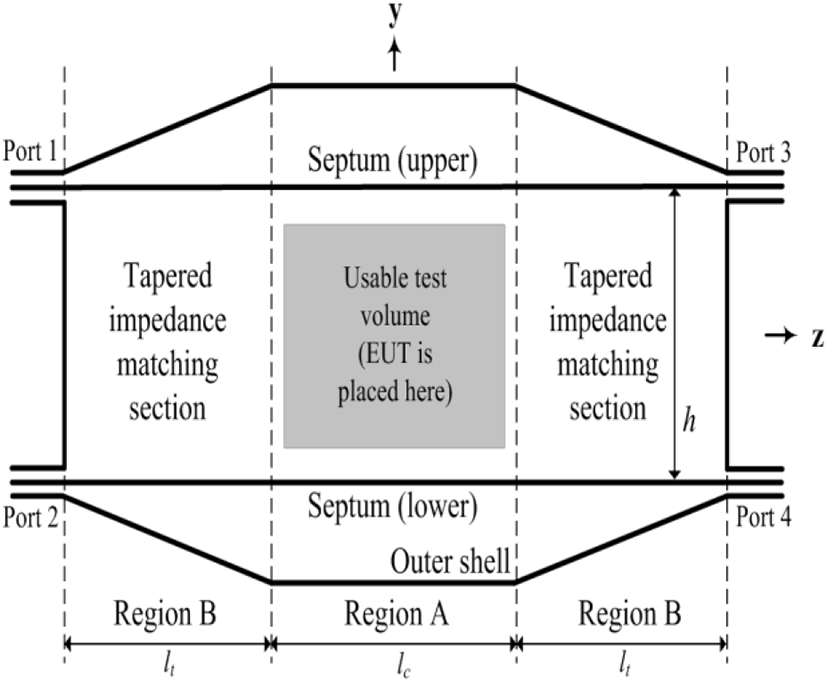
The four-port TEM cell used for the TEM mode verification is shown in Figure 1. The four-port TEM cell has two parallel septa connected to four ports at each end. We set the lengths of regions A and B to be equal, that is, lc=lt. The overall size (lc+2lt) of the cell is 900 mm in length, 435 mm in width and 450 mm in height. The characteristic impedance is 50 ohms at each port.
The operation method to generate TEM mode is shown in Figure 2. To generate the TEM mode wave in usable test volume, the input signal should be applied to ports 1 and 2 with a reversed phase, and a 50 ohms load resistance allows for termination at each other port, that is, 3 and 4. Because of the symmetry, ports 1 and 2 are interchangeable with ports 3 and 4, with no change in the generated TEM wave property.
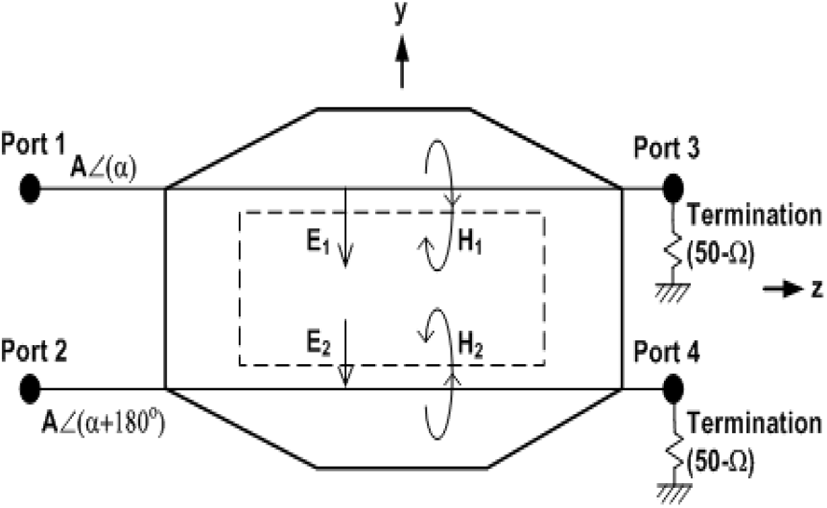
Figure 3 shows setup of the four-port TEM cell for TEM mode verification. Field evaluation area is shown as the shaded square in Figure 3, which is 250 mm x 250 mm. Electric fields are measured at intervals of 10 mm both in the x- and y-directions using a field probe, which provides total 676 measurements. It means 676 measurements points are taken for the TEM mode verification.
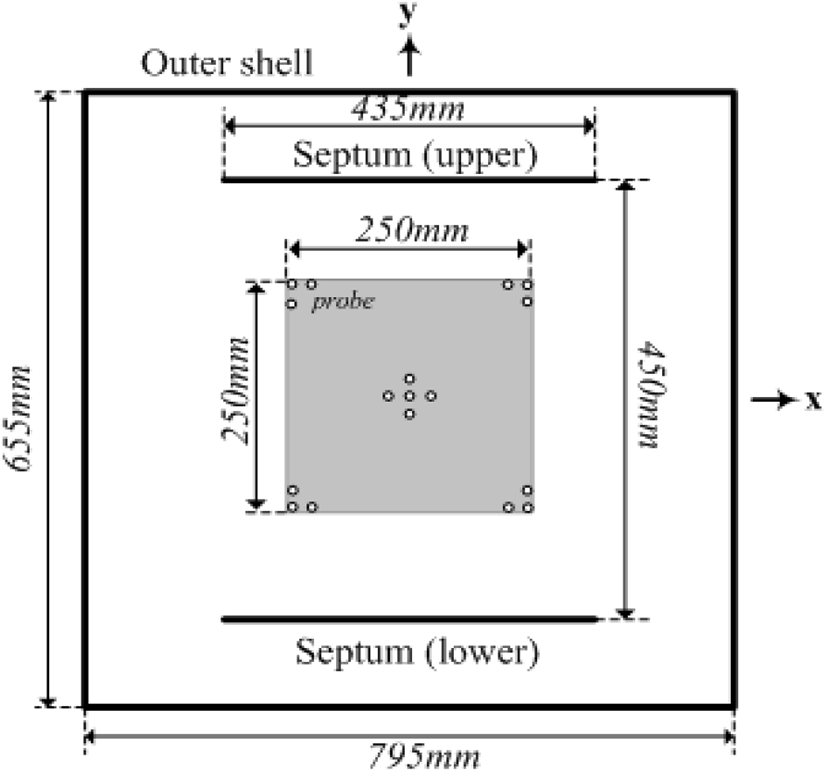
Figure 4 shows the distribution of electric field and magnetic field in four-port TEM cell.
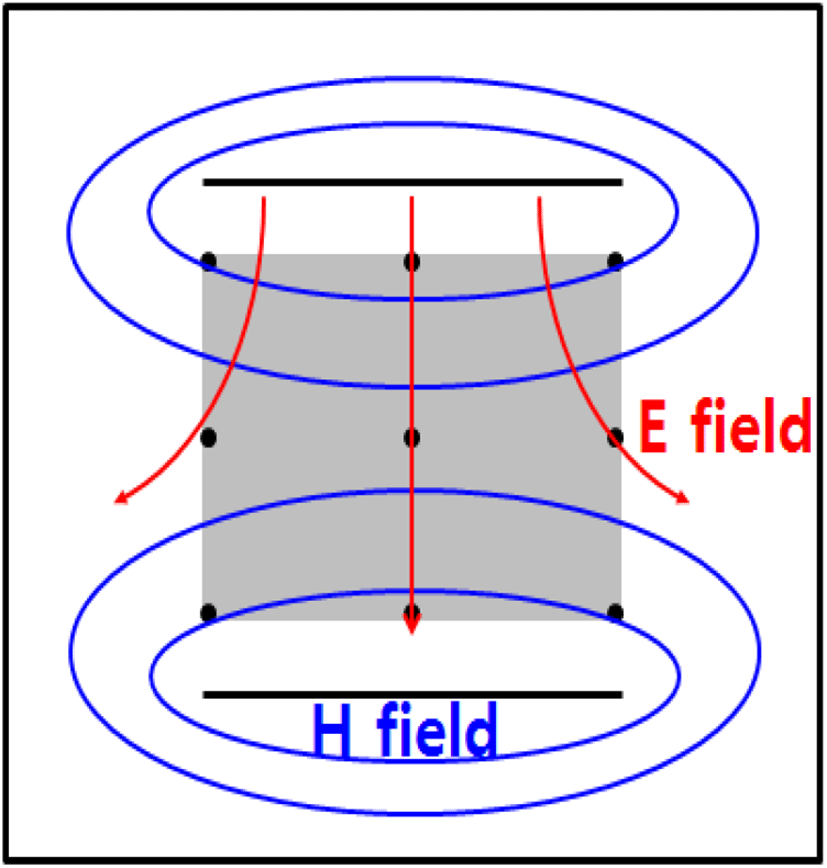
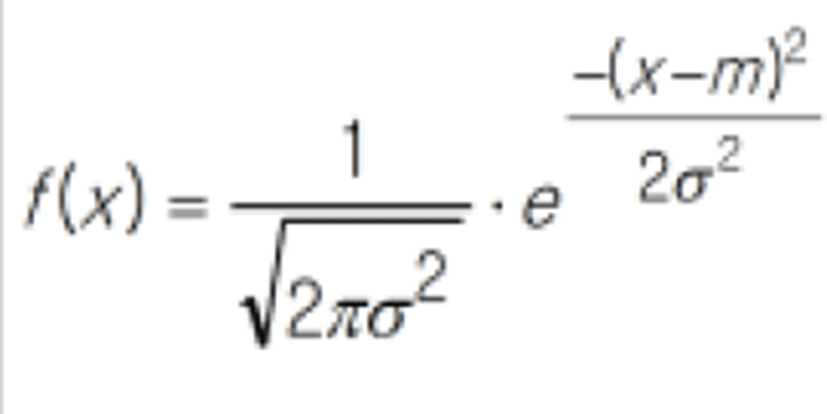
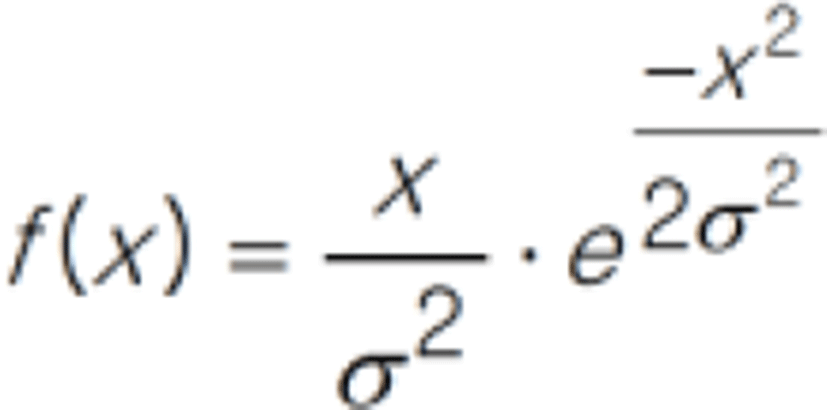
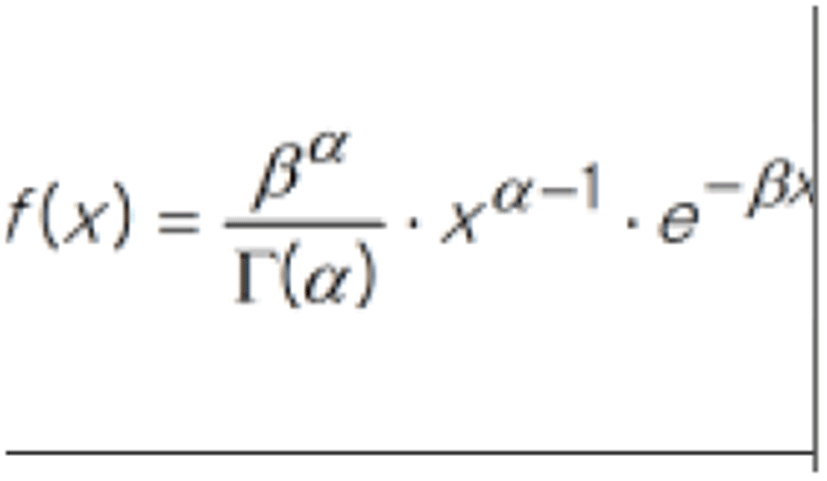
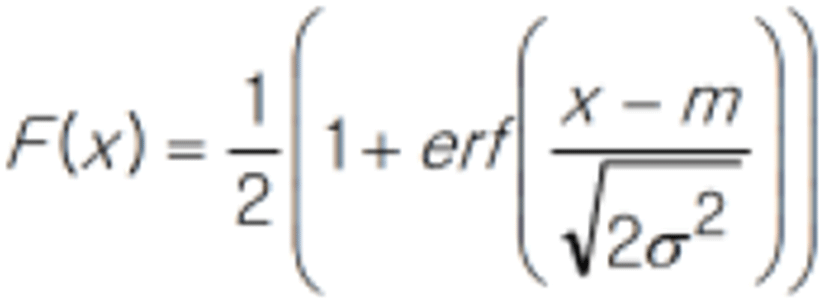
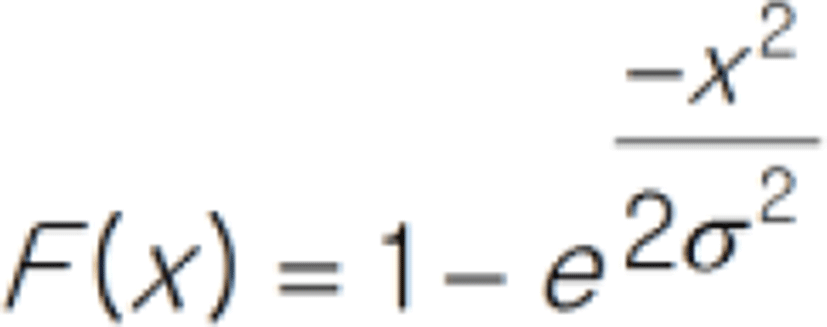
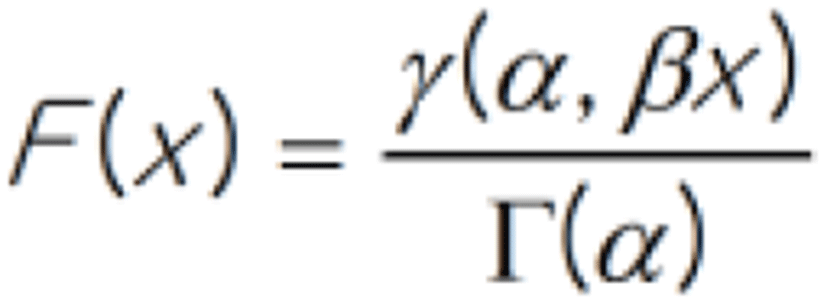
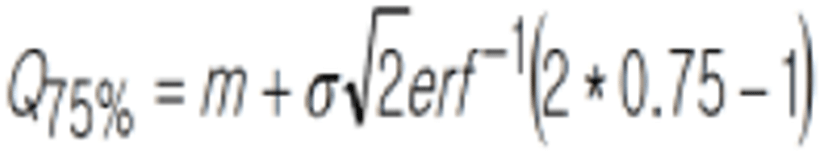
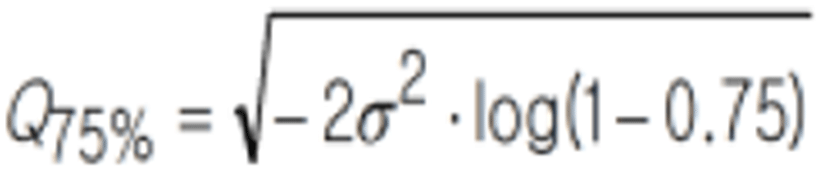
Table 1 shows the formulas of probability distribution function (pdf), cumulative distribution function (cdf) and quantile function for Normal, Rayleigh, and Gamma distribution.
| Normal distribution | Rayleigh distribution | Gamma distribution | |
|---|---|---|---|
|
|
|
|
| cdf |
|
|
|
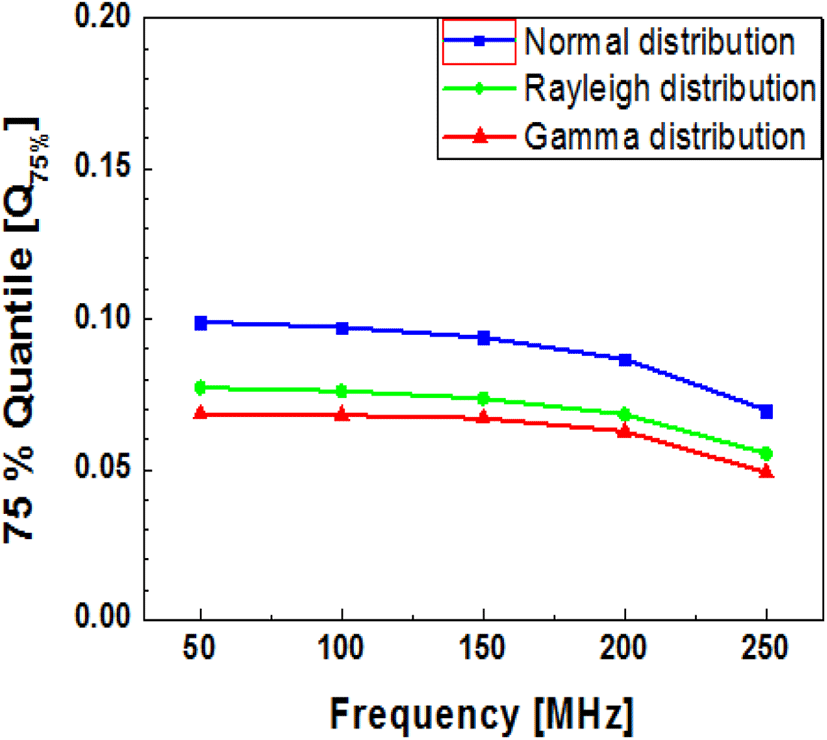
| 75 % quantile |
|
|
- |
We investigate field distribution at different frequencies using the CST Microwave Studio as shown in Figure 5 [15]. At test point i the measured primary field component is given as Eprim and the secondary field component as Esec. Both values are to be expressed for 676 test points in linear values. Using Table 1, the statistical distribution can be calculated from the measured field components. For example, the normal distribution is calculated from average and variance obtained from ratio of primary field component and secondary field component. And the Rayleigh distribution is calculated from only one of the parameter of variance. However, the gamma distribution is calculated from two parameters which are α and β have to be calculated numerical. Also, the 75 % quantile is determined using Table 1.
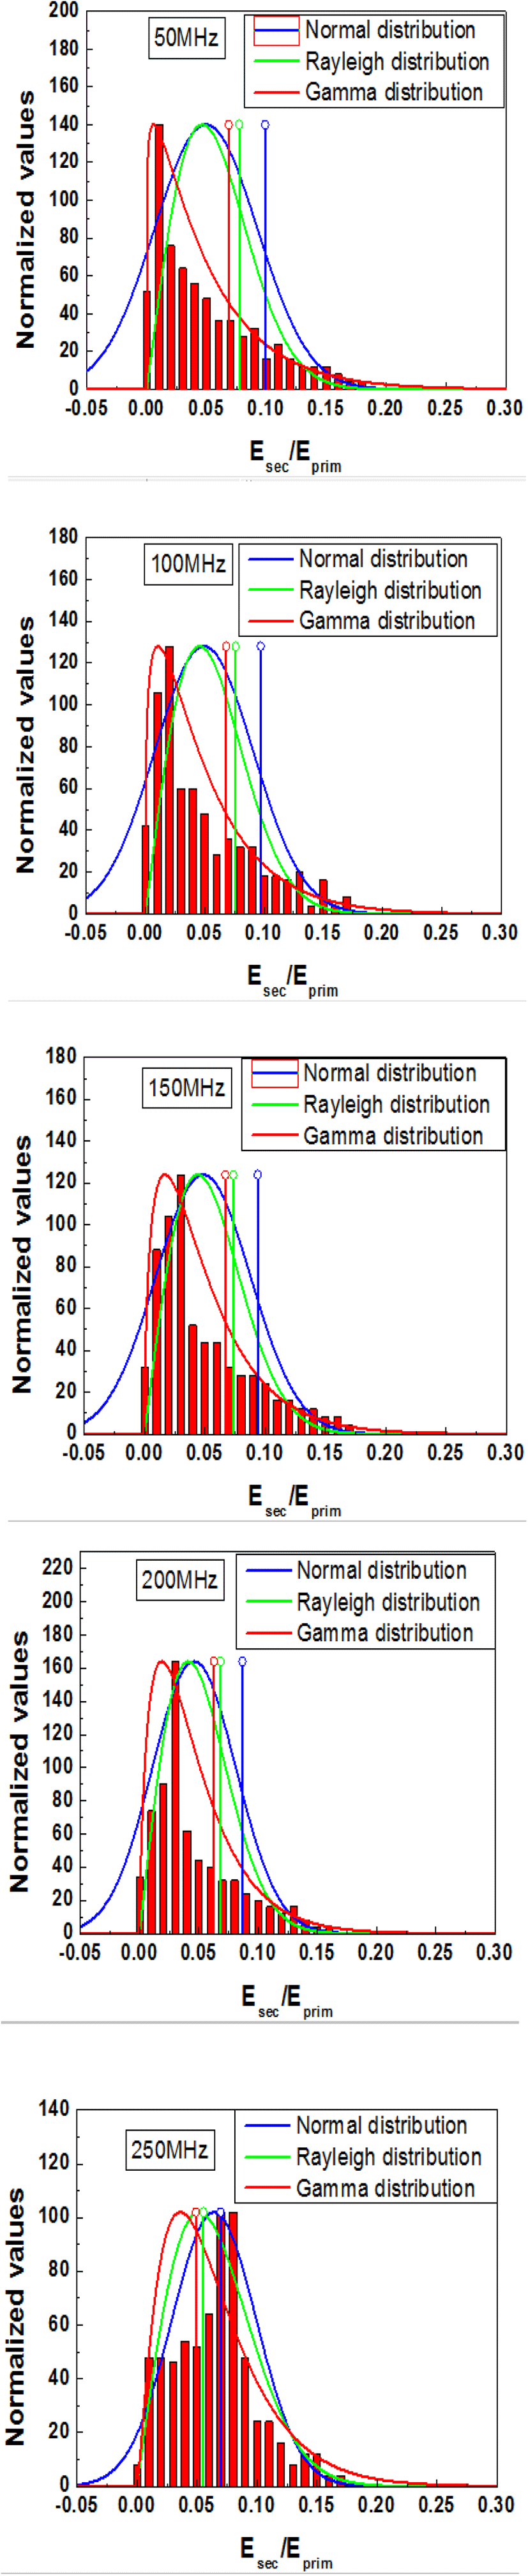
As shown in results, the pdf of Normal distribution does not correspond to measurement data. But the Gamma distribution represents the best result. However, its 75 % quantile cannot easily be estimated from a set of data. Because, the Gamma distribution two parameters have to be calculated numerical and its cdf function cannot be solved analytically. Therefore this is not practicable for a standard calibration procedure. However, the one parameter of the Rayleigh distribution can easily be estimated from the measurement data. Furthermore its 75 % quantile can be calculated analytical from σ. The 75 % quantile evaluated at five measured frequencies are also calculated in Figure 6.
III. CONCLUSION
We analyzed the verification of TEM mode with statistical approach in four-port TEM cell, which is, used the calibration of EM field probe. The verification of TEM mode with the statistical approach is investigated. We presented Normal, Rayleigh, Gamma statistical distributions of electromagnetic fields in a four-port TEM cell. As shown in this paper, the Rayleigh distribution is good agreement with the measurement data and the verification of the TEM mode shall be carried out with the 75 % quantile of the Rayleigh distribution.