


I. INTRODUCTION
In recent years, for decreasing carbon emission, renewable energy such as wind power and solar photovoltaic are focused on. Renewable energy is ecological, but the amount of generation is affected by weather conditions. In this sense, it can be stated that renewable energy is unstable in time. Therefore, it is necessary to comprehend the power-flow states, in case that the renewable energy generators are included in power systems.
The power-flow state is obtained by power flow calculations. Various simulators, which calculate power flows have been developed until now [1, 2]. Generally, power-flow simulators such as MATPOWER [1] need to prepare an IEEE common data format file. When users would like to simulate a user-defined power system, it is necessary to prepare an IEEE common data format file in the text format, which is one of the barriers for power-flow simulations. In addition, visualizing power flow helps users to get a whole picture of the power system [3, 4].
These simulators, however, do not have a function that the power-system diagram is illustrated automatically from an IEEE common data format file [5]. Therefore, it is difficult to simulate power flows of user-defined power systems. Additionally, it is effective to visualize the time-varying power flow for simulating the power system with renewable energy generators. From above the reasons, it is useful and valuable to develop a software, which generates an IEEE common data format file from network diagrams, illustrates the system diagram from an IEEE common data format file, and visualizes time-varying power flows automatically.
In this paper, a power-flow simulator with visualization function is proposed and implemented. The proposed simulator has a function of automatic generations of an IEEE common data format file from user-drawn power-system diagrams. Therefore, it is possible for users to carry out simulations only by drawing the system diagram on display. In addition, the proposed simulator also has a function that power-system diagram is illustrated automatically from IEEE common data format files. Namely, it is easy to comprehend power flows of both pre-defined and user-defined power systems. By visualizing amounts and directions of power flows on the power-system diagram, it is possible for users to comprehend network dynamics intuitively. Additionally, the proposed simulator allows including renewable-energy generators in user-defined power systems, which is helpful to evaluate power distribution systems. By iterative executions and flow visualizations, it is also possible to comprehend the time variations of the power flows easily. It is expected that the proposed simulator helps to make control and/or optimization strategies of the power systems.
II. PROPOSED SIMULATOR DESIGN
The proposed simulator visualizes amounts and directions of power-flow along branches through the power-flow calculations. The power-flow calculations are driven by an IEEE common data format file, which is generated automatically from power-system diagram on display. The proposed simulator is written by C language with OpenGL and OpenCV libraries.
Fig. 1 shows a construction of the proposed simulator. The proposed simulator is composed of three engines, which are Calculation, Visualization, and System-file Generation engines.
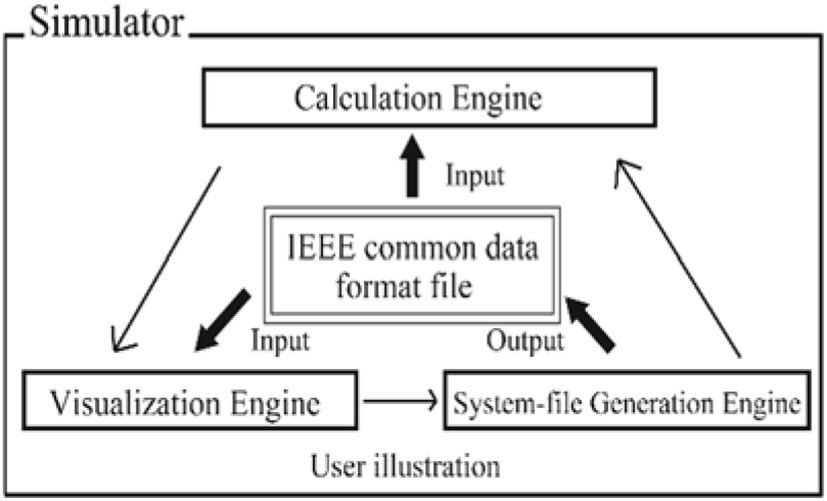
The Calculation engine has two functions. One is a power-flow calculation function and the other is a calculation function of renewable-energy amounts.
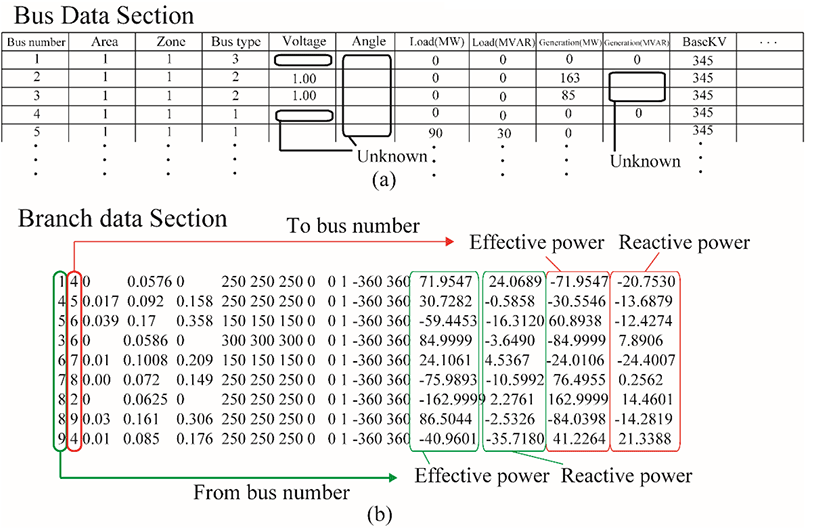
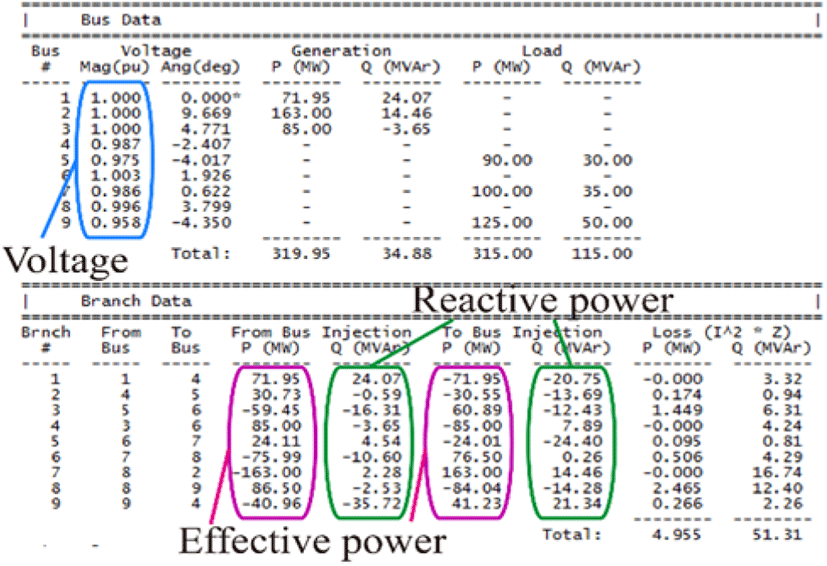
The Calculation engine calculates power flow from an IEEE common data format file. The IEEE common data format is composed of the bus-data and branch-data sections. Figure 2 shows an example of the bus-data and branch data sections in IEEE common data format file. The bus type number is defined as given in Table 1. The Calculation engine reads information of loads, generations, and voltages from the IEEE common data format file, which are used for the power-flow calculations. The load, generation, and voltage parameters are written in column 5, 7, and 8 of the bus-data section in IEEE common data format file as shown in Figure 2(a). The calculation results of voltages, angles, and generations are filled in column 5, 6, and 10 of bus data section. The effective powers and reactive powers are written in column 14, 16, 15 and 17 of branch data section respectively as Figure 2(b).
The Calculation engine also calculates the amounts powers of renewable energy generations. If users input wind speed data as shown in Table 2, the Calculation engine calculates the amount of renewable-energy powers, which is filled in the column 9 of the bus data section. The wind generation model is described in subsection II-5.
| Timeslot number | Wind speed [m/s] |
|---|---|
| 1 | 3.8 |
| 2 | 2.1 |
| 3 | 2.6 |
| 4 | 1.8 |
| 5 | 1.2 |
| 6 | 2.8 |
| 7 | 3.3 |
| 8 | 3.6 |
| 9 | 2.9 |
| 10 | 3.9 |
| 11 | 6.7 |
| 12 | 7.6 |
The Visualization engine has three functions. The Visualization engine provides a platform to draw system diagrams. This function enables users to define the power system arbitrary, which is expressed graphically by users. The Visualization engine outputs a system diagram automatically from an IEEE common data format file. The branch intersections are reduced by applying the spring model [6] for drawing the diagram.
The Visualized engine also have a function to show power-flow states graphically. The Visualization engine obtains power-flow information by reading column 14 or 16 of the branch-data section in the IEEE common data format file. The Visualization engine displays effective-power values and expresses flow directions by arrows at each branch.
The System-File Generation engine can generate a text file with the IEEE common data format from user-drawn system diagram at the Visualization engine. The System-File Generation engine recognizes the number of buses and the states of branch connections from the user-drawn system diagram. By using the IEEE common data format file, which can be obtained from the System-File Generation engine, the Calculation engine executes power-flow calculations at any system configuration.
It is seen from Figure 1 that the interfaces among three engines are IEEE common data format file, which is our important concept to implement the proposed simulator. The essential functions of the proposed simulator are described in detail in the following subsections.
The Calculation engine executes power-flow calculations following the given IEEE common data format file. The electrical current Ii from i th bus with N bus system is described as
where Vj is voltage at j th bus and Yij is the admittance between i th bus and j th bus. The effective power Pi and reactive power Qi have a relationship as
According to (1) and (2), the effective power and reactive power are also expressed as
In this simulator, Newton-Raphson method is applied for solving the algebraic equations in (3). From the solutions of the algebraic equations, effective powers, reactive powers, voltages, and angles of all the buses are obtained.
If users or the System-file generation engine gives an IEEE common data format file, the Visualization engine draws the power-system diagram automatically. For avoiding bus overlaps and branch intersections, the spring model [6] is applied for drawing power systems.
In the spring model, two forces are put on each buses, which are the spring and the coulomb forces. They are expressed as
where d is the branch length. In addition, all buses are sorted in the order of connected branch number. A bus, which has most branches, is located in the center of display. Other buses are located one by one following the order. The initial coordinates of the buses are given by
where pb and p̅ is the average values of bus coordinates, which are connected to the putting bus, and have already located, respectively.
Fig. 3 shows the system diagrams of IEEE 30-bus system. Fig. 3(a) and (b) shows the formulated diagram in [9] and automatic drawn diagram by the Visualization engine from the IEEE common data format file, respectively. It is seen from Fig. 3(b) that some branch intersections remain. Therefore, we prepare the function that users can move buses with drag on the display for reshaping the diagrams. Fig. 3(c) is an example of the reshaped network diagram. Compared with Fig. 3(b), the branch intersections in Fig. 3(c) are reduced and it is easy to find the network topology. The proposed system provides user-like power-system diagrams the automatic-illustration and the user-reshaping functions.
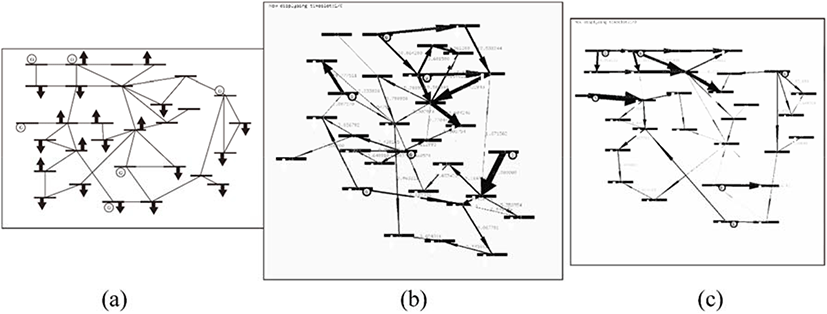
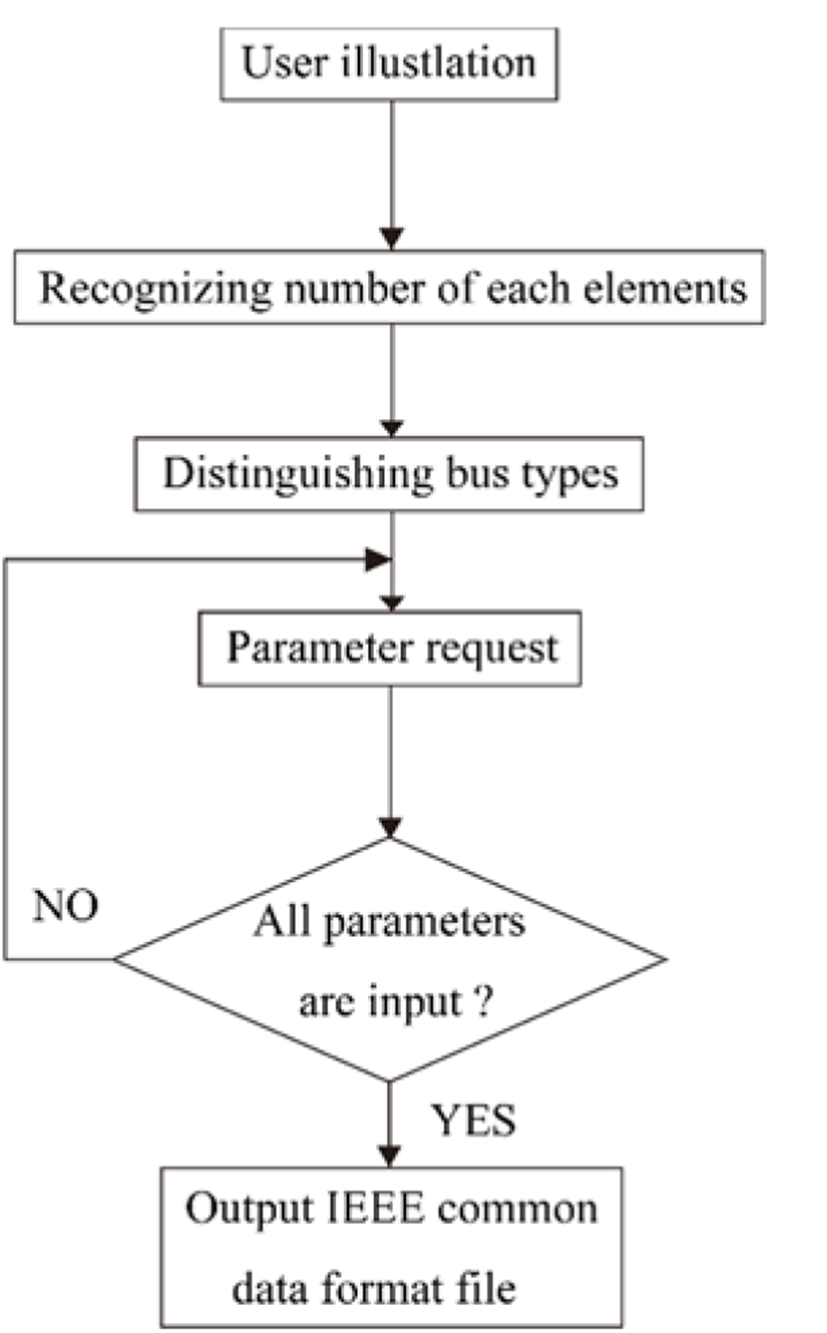
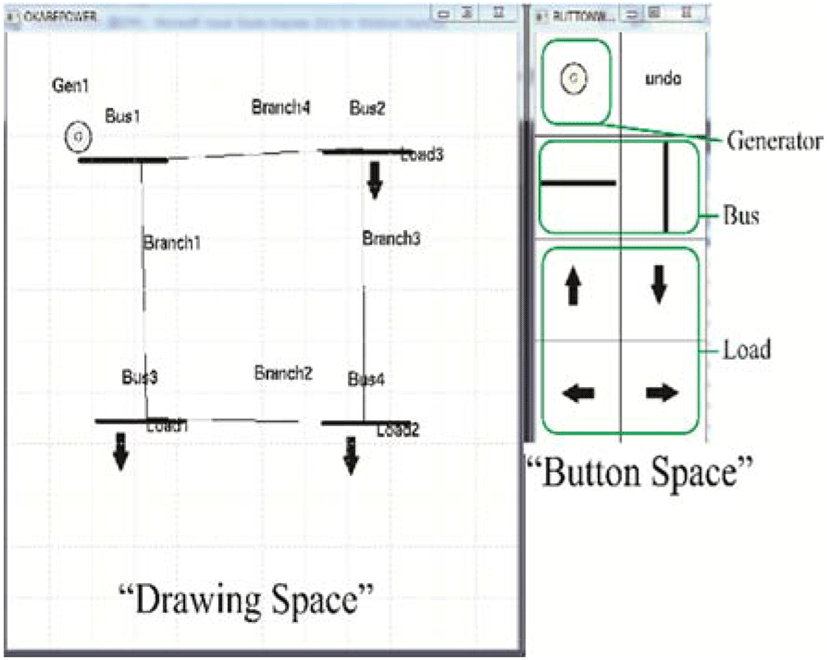
Fig. 4 shows the flowchart of generation of IEEE common data format files. First, the System-file Generation engine recognizes the connection states of each bus and the components of a network from user illustration. Second, the System-file generation engine distinguishes the bus types according to Table 1 and requires each parameters to complete IEEE common data format file. The bus type corresponds to connection state of loads and generators. The reference bus, whose angle is reference of the system, is classified into the bus-type 1. The buses with generator are in the bus-type 2 and the other types of buses are in the bus-type 3. Finally, according to bus types, the System-file generation engine makes a table following the IEEE common data format and fills parameters in the table. By implementing this function, power-flow simulations can be carried out without preparing the IEEE common data format file. Fig. 5 shows the snapshot of the drawing window. Symbols illustrated in the diagram are the same as ones in Fig. 4. Users can draw the system diagram by choosing elements from “Button Space” and deploying the elements in “Drawing Space” as shown in Fig. 5. Branches are drawn by dragging between buses.
The bus-connection states are recognized automatically. When user draws a branch, the simulator searches buses which are end points of the branch. If there is no bus at one-side or both sides of the branch ends, the System-file generation engine recognizes that the system diagram includes errors. In this case, the Visualization engine requires the user to modify the system diagram. Conversely, if there are two buses at both ends of the branch, the System-file generation engine allocates a number to branch and retain the connected bus number. The susceptance and reactance of each branch is required by the System-file generation engine posterior to drawing the power system. As result, the IEEE common-data-format file is generated according to input parameters, which is used for the power-flow calculation.
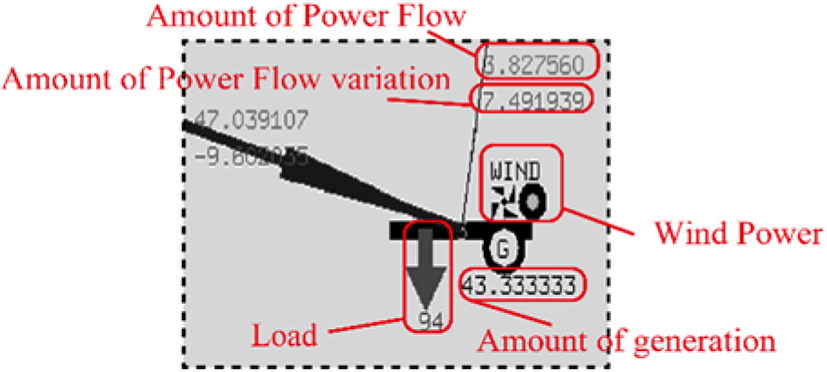
The power-flow-calculation results are visualized at the Visualization engine. The arrow thickness and direction express the amount and the direction of the power flow, respectively.
The Visualization engine can visualize time-varying power flow with renewable energy. The Calculation engine calculates generated powers by wind-power generators from the given wind speed. When wind power generator are included in the system configuration, the System-file generation engine requires time-series of wind speeds, which determines the generation powers of the wind-power generators as shown in Table 2. Amount of generation powers of wind-power generators in MW is modeled as equation (6), where v(t), vci, vco and vr are the wind speed at time t, cut-in, cut-out and rated wind speeds in m/s respectively, and Pwrated in MW is the rated output power of the wind generator [7]. It is necessary to update the generation amounts, which are filled in column 9 of the bus data section every power flow calculations. Namely, the System-file generation engine generates an IEEE common data format file at every sample time, and the power flow calculation results are displayed by reading IEEE common data format file in time series. Therefore, it is possible comprehend the time variation of the power flow intuitively. The visualized data are the effective powers, which are obtained from the columns 14 and, 16 of branch data in the IEEE common data format file. The values of renewable energy generations are also displayed as shown in Fig. 6.
III. SIMULATOR EVALUATION
For confirming the validity of three engines, authors carry out two simulation with formulated IEEE bus systems. In addition, authors also simulates formulated system including wind power generation to confirm visualization of time varying power flow.
In this section, the power-flow simulates are carried out for the IEEE 9-bus system by using the proposed simulator without IEEE common data format file. The IEEE 9-bus system was drawn by authors with the Visualization engine. Fig. 7 shows a network topology of the IEEE 9-bus system drawn by authors. This figure follows the original network-topology illustration in [9]. By executing the System-File Generation engine with the drawn topology in Fig. 7, we obtained the IEEE common data format file of the IEEE 9-bus system.
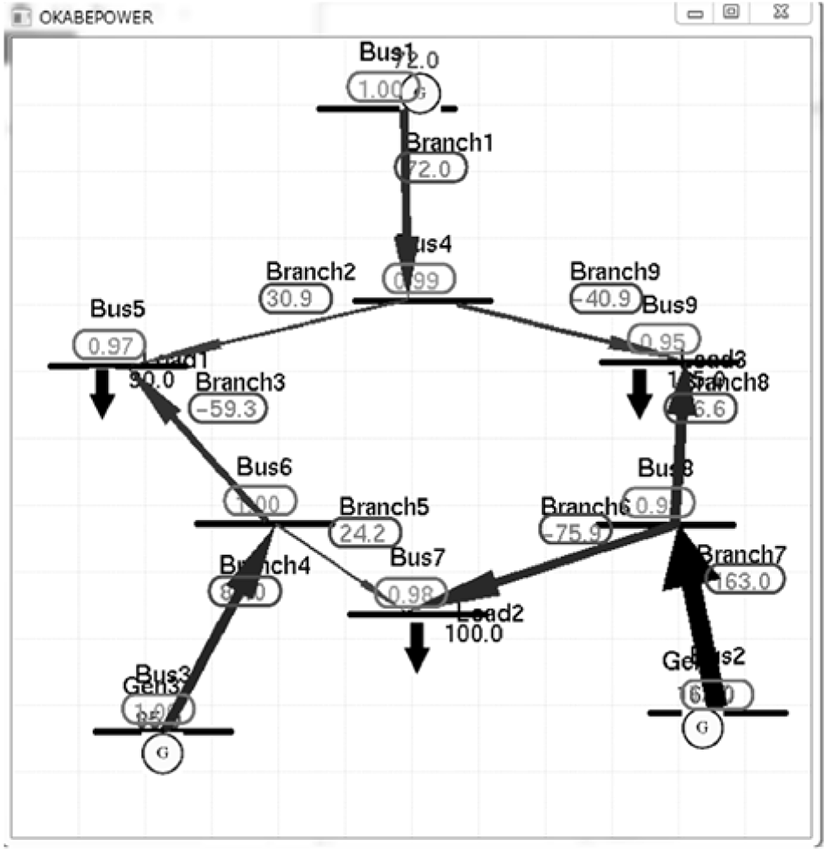
Fig. 8 shows the IEEE common data format file, which is generated by the System-File Generation engine from the power-system diagram in Fig. 7. The numbers within the circle line in Fig. 8 describe the power-flow calculation results of the Calculation engine. Compared with the IEEE common data format file in [9], it is confirmed that the descriptions in the generated IEEE common data format file is completely the same as those in the standardized IEEE 9-bus system file, which shows the reliability of the System-File Generation and Visualization engines.
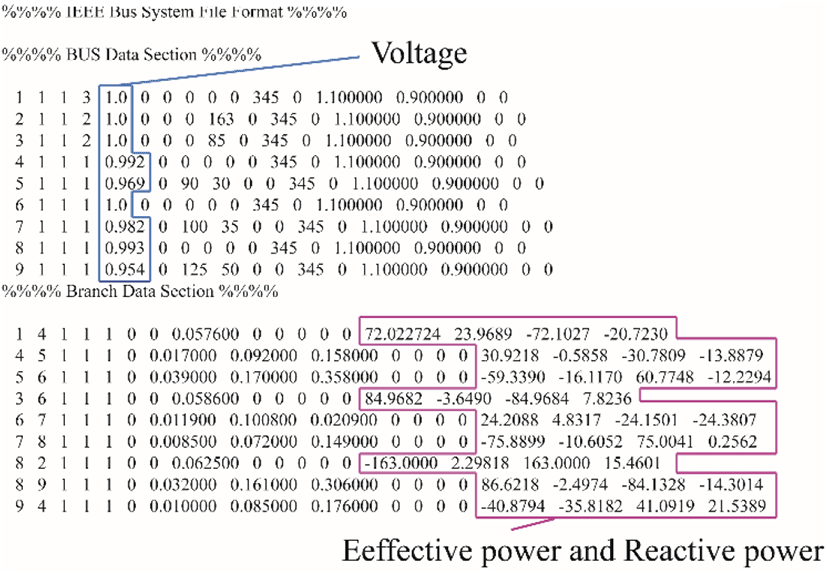
Fig. 8 shows the IEEE common data format file, which is generated by the System-File Generation engine from the power-system diagram in Fig. 7. The numbers within the circle line in Fig. 8 describe the power-flow calculation results of the Calculation engine. Compared with the IEEE common data format file in [9], it is confirmed that the descriptions in the generated IEEE common data format file is completely the same as those in the standardized IEEE 9-bus system file, which shows the reliability of the System-File Generation and Visualization engines.
For confirming the validity of the Calculation engine, power-flow simulations with IEEE 9-bus system were also carried out by using MATPOWER [1]. Fig. 9 shows the calculation results from the MATPOWER. It is seen from Fig. 8 and Fig. 9 that the power-flow calculation results from the proposed simulator agree with those from MATPOWER, which shows the reliability of the Calculation engine.
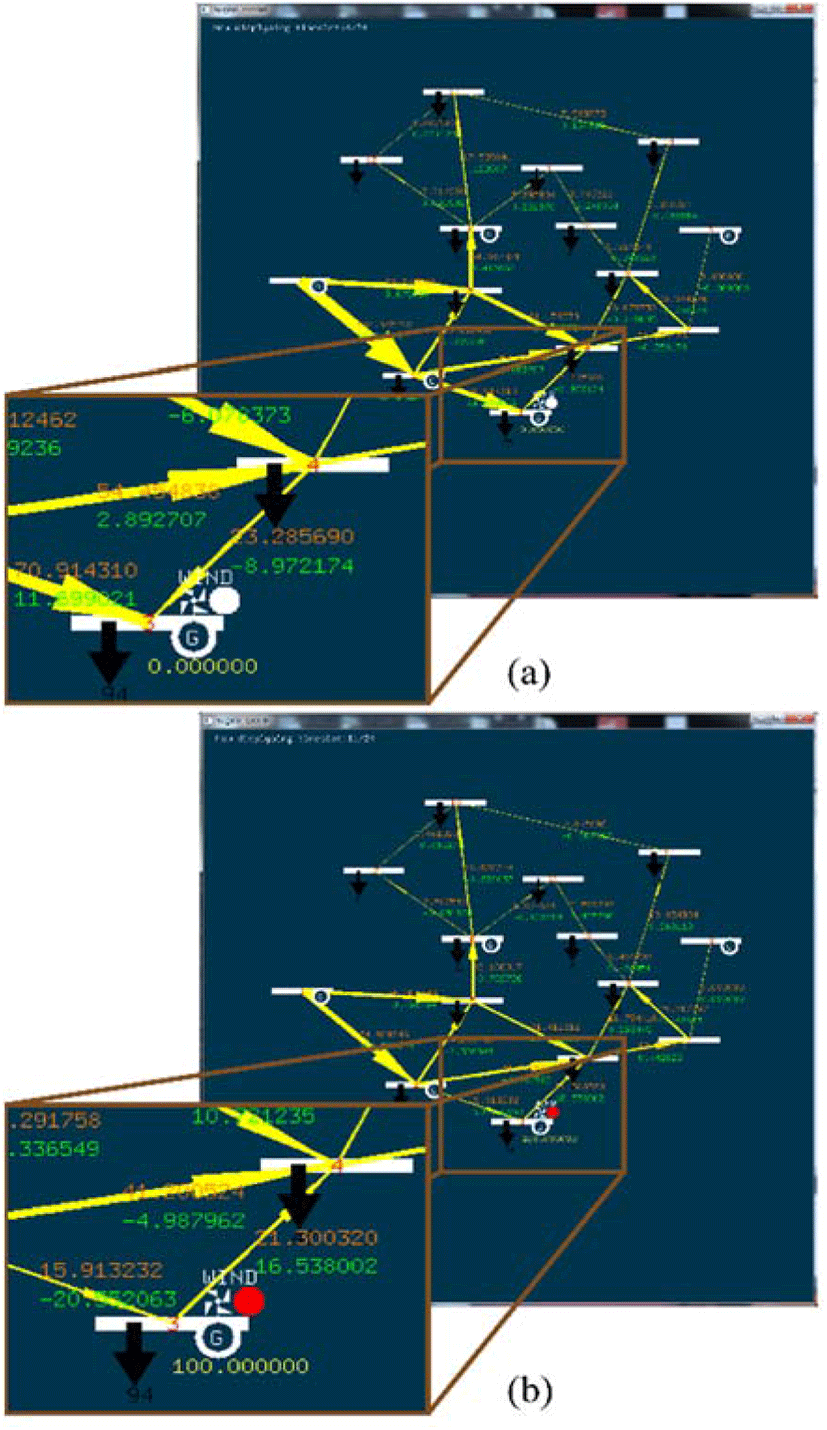
For evaluating the power-flow visualizations, the power-system simulations with a wind-power generator were carried out. Fig. 10 shows the network topology of the simulations. We used the IEEE 14-bus system as the basic power system. Additionally, a wind-power generator was added to the bus 3. Table 3 gives the specification of the wind generator in this simulation. The wind data, which is the same as that in Table 2, is given in this simulation. It can be confirmed from Fig. 10(a) and (b) that the thickness and directions of arrows vary. This is because the wind speed is changed from 1.8 m/s at t=4 to 6.7 m/s at t=11 as shown in Table 3 and power-flow variations occur. It is possible to comprehend power-flow variations according to natural environment variations intuitively from the visualized power-flows results. It is confirmed from Figs. 10 that user-friendly display of power flows can be achieved by the Visualization engine.
| Parameters | Values |
|---|---|
| Cut-in wind velocity vci | 2.0[m/s] |
| Cut-out wind velocity vco | 7.0[m/s] |
| Rated wind velocity vrated | 5.0[m/s] |
| Rated generator output Pwrated | 100[MW] |
The demonstration video of the proposed simulator appears in [10].
IV. CONCLUTION
This paper has proposed and implemented the power-flow simulator with power-flow visualization function. The proposed simulator is composed of three engines which are Calculation, Visualization, and System-file generation engines. The IEEE common data format file integrates three engines. Because the proposed simulator allows including renewable-resource generators in the power system, it is effective to evaluate the power distribution systems. It is shown that the proposed simulator can generate accurate IEEE common data format files and intuitive power-flow visualizations.
The supports of system-fault recognitions, new system components such as battery, and optimization functions are necessary in the simulator, which should be addressed in the future.