


I. INTRODUCTION
In recent years, the advent of efficient graphical processing units (GPUs) and efficient volume rendering algorithms has resulted in the rapid adoption of direct volume rendering (DVR) techniques that provides 3D views and interactive volumetric navigation. These techniques have been implemented among imaging modalities for clinical diagnosis [1], surgical and radiotherapy planning [2] and also training [3]. A core advantage of DVR over 2D cross-sectional views is the 3D depiction of the full volumetric data which allows for instance tracking the path of vessels in the body [4]. Nevertheless, the majority of medical imaging visualizations still rely on conventional 2D cross-sectional views, such as in multi-planar reformatting (MPR) as shown in Figure 1(a). This is primarily due to the inherent occlusion in DVR which renders the entire image volume, thus preventing parts of the image volume, such as the tumor as the region of interest (ROI) and its surrounding structures, from being visible, as shown in bottom-right quadrant in Fig. 1(a). Transfer function, (TF), which lets a user manipulate opacity and color applied to voxels in an image volume, can be used to control the visibility of certain structures or ROIs. However since the TF is applied to the entire volume, it can therefore be a difficult task to localize a single ROI. Advances in TF manipulations has made ROI localization simpler, but it typically demands additional pre-processing of the image volume e.g., labelling of the ROI prior to rendering [4]. Volume clipping is another approach to localize the ROI where the volume is cropped to remove structures that are occluding a ROI, followed by TF manipulations [4]. However, the limitation of clipping is that it loses the information that was in the clipped volume. Embedding a slice of interest (SOI) into the DVR provides localized 2D information in the context of the 3D view offered by the DVR (see Figure 1(b)). However, in the example of Fig. 1(b) the occlusions from the heart and the bones from the DVR are overwhelming and this needs to be adjusted via combination of volume clipping and TF adjustments which adds time and complexity to the visualization. Such limitations, therefore, reduce the practicality and usefulness of DVR in medical visualization.
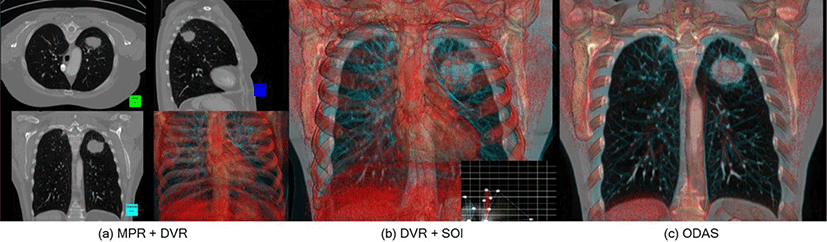
In this study, we propose a new visualization algorithm where we augment the 2D SOI from an image volume with volumetric information derived from the DVR of the same volume. Our occlusion-based DVR augmentation for SOI, which we refer to as the ODAS, uses the occlusion information derived from the voxels in front of the SOI to calculate a depth parameter, (D), which controls the amount of the DVR visibility to provide 3D spatial cues while not impairing the visibility of the SOI. In this process, no volume is clipped while a dynamic weight curve function applied to the TF ensures that the DVR does not impair the visibility of the SOI. Figure 1(c) is an example of our ODAS visualization where the tumor structure in the SOI is clearly visible while the DVR augments additional spatial cues in the form of anatomical definition of the tumor’s surrounding structures. We present the capabilities of our ODAS in the visualizations of computed tomography (CT) images with various anatomies, and in real-time volume rendering, when compared to the conventional DVR algorithms.
II. RELATED WORK
The key strength of volume rendering is the volume ray-casting algorithm, which allows a final rendering to depict the whole volume data at once, in a way where optical properties of the voxels along the viewing ray can selectively contribute to the rendering. In DVR, optical contributions for every voxel along the ray are accumulated by the optical mapping defined by the TF. Thus, DVR visualizations can usually provide a good representation of the entire volume. However, the occlusion is often a challenging problem; which is mainly because the final optical values do not only depend on the TF setting, but also on the number of voxels that are to be accumulated along the viewing ray [5]. Even with advanced multi-dimensional TFs [6-8] and TF automation algorithms [9-10], it is often difficult to design an appropriate TF to visualize a special ROI with details of its surrounding structures.
A common approach to visualize the whole volume without occlusion of the ROI is via a maximum intensity projection (MIP), which is a variation of volume ray-casting, where only the maximum intensity value, in this case belonging to the ROI, along the ray contributes to the final rendering. Although useful, MIP’s inherent limitation is the loss of depth and neighboring contextual information which can hinder the visualization [11]. Borrowing the concept of selectively rendering the contributions of particular voxels from MIP, several algorithms were developed [12-13]. In a recent study, Sato et al. [13] proposed the use of the first value above a ‘threshold’ that represents e.g., ROI on a given ray instead of the maximum value over the whole ray.
The concept of identifying an important voxel in volume ray-casting has also been applied to DVR algorithms. Bruckner et al. [14] exploited the maximum intensity value along the ray to adaptively modulate the accumulated opacity. Such modulation allowed contextual information in front of the maximum value to be better preserved. Marchesin et al. [15] quantified the ‘relative importance’ of each voxel to the final rendering by defining a gradient based relevance function which is integrated to the ray-casting to ensure contributions from all ROIs, especially boundary regions. Similarly, Bangjie et al. [16] used relative distance of voxels to a view-point to adjust the accumulation of the opacities when the accumulated opacity reaches a certain limit. Although their work allowed all structures along the ray to be conveyed, it disturbed the visual perception of internal structures where the ROIs localized further along the ray would be attenuated by their subsequent ROIs. The algorithms discussed above, which are primarily designed to remove the occlusion of structures to the ROI in volume rendering, and thus are fundamentally different to our proposed algorithm which uses an SOI and the depth parameter to automatically define a TF to emphasize structures that are near the SOI while de-emphasizing structures that are distant to it.
Visualizations that combine 2D views such as an MPR with 3D views from the same volume provides improved contextual information for diagnostics purposes, while the 3D view acts as an overview to the volume in the context to the cross-sectional 2D views [17]. However, the synchronization of the image manipulations from one view to another is unintuitive due to the lack of a feedback mechanism from the interaction of one view to the other [18]. To ease the interaction with such multiple views, one of the most intuitive techniques is commonly referred to as the ‘picking’. It allows the user to ‘pick’ an ROI in 3D rendering which is then used to adjust a 2D slice of the ROI and vice versa. Kohlmann et al. [19] proposed a variation to this picking method called ‘contextual picking’ that was tailored for medical images. The contextual information available from the image’s header (DICOM file) was used to deduce the anatomical parts of the volumetric image the user intends to pick (e.g., vessels in CT image). This, however, meant that contextual information had to be available and be accurately deduced. Wiebel et al [20] presented a visibility driven picking method named ‘What You See is What You Pick’ that asks the user to select what they see instead of what is known to be in the volume. This picking method also presented a fused visualization where an image slice aligned with the picked position was blended with the DVR.
Volume clipping is another interaction technique to navigate through 3D volume by ‘cutting away’ the volume; however by removing part of the volume, it has been shown to add confusion and partly mislead the visualization [4]. Viola et al. [21] introduced importance-driven volume rendering where an ‘importance value’ was assigned to the pre-segmented ROIs. Using the ROIs, it generated a cut-away view, which retained the visibility of ROIs with high importance by reducing the visibilities of the ROIs with assigned lower importance. In another approach, Burn [22] divided regions occluding the ROIs into three clusters of importance for rendering. In the above methods, the selection of the ROI and also the assignment of the importance are usually manual-driven and / or involve segmentation of the ROIs as a pre-process.
III. METHODS
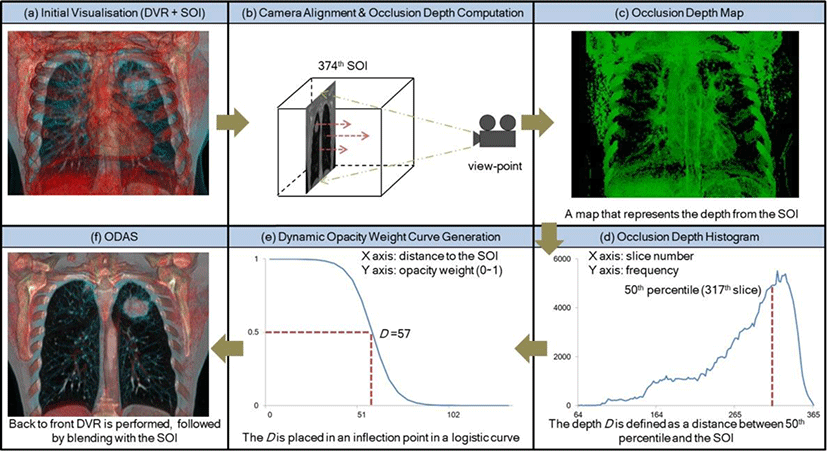
Our ODAS consists of six main processes and is shown in Figure 2: (a) once an SOI is determined by the user, an initial TF is designed to depict relative structures to the SOI e.g., lung tissues and bone. An initial DVR is then rendered with the fusion of the SOI; (b) the camera is aligned with a cross-sectional view of the user-defined SOI, in this case 374th SOI with the coronal view, and its occlusion depth is calculated. Each pixel from the aligned SOI casts a ray to a view-point and opacity accumulation for the voxels along the ray is performed until the accumulated opacity reaches a certain threshold (fixed to 0.5); (c) each pixel of occlusion depth map consists of the 3D coordinates where the accumulation ends. In this example, y coordinates stored to green components, which are perpendicular to the coronal view, represent the level of the occlusion depth. Note that we do not consider the background, which is always maximally occluded, to calculate the accurate occlusion depth; (d) through another rendering pass, we construct a histogram for the occlusion depth map where the x axis is the depth coordinate (here y position), and the y axis is its frequency. The depth D is calculated as the distance between a depth computed as 50th percentile of the histogram and the SOI, which ensures that all structures close to the SOI are visible. In this case, 57 slices are used as the depth D; (e) based on the D, an opacity weight curve with logistic function shape, where the x axis and the y axis indicate the distance from the SOI and its weight, is generated to emphasize structures before the D as well as deemphasizing other structures after the D. In the curve, the D is localized in its inflection point; (f) volume ray-casting is performed the same way as in the occlusion depth computation, with the opacity weight curve, and finally, the SOI is blended with the resultant DVR image, with a fusion ratio of 0.5. Note that we balance the amount of visual information from SOI and DVR to be equal. The resultant visualization enables augmentation of its surrounding lung tissues in the form of depth depictions while minimizing the obtrusiveness to the visibility of the lung tumor of the SOI.
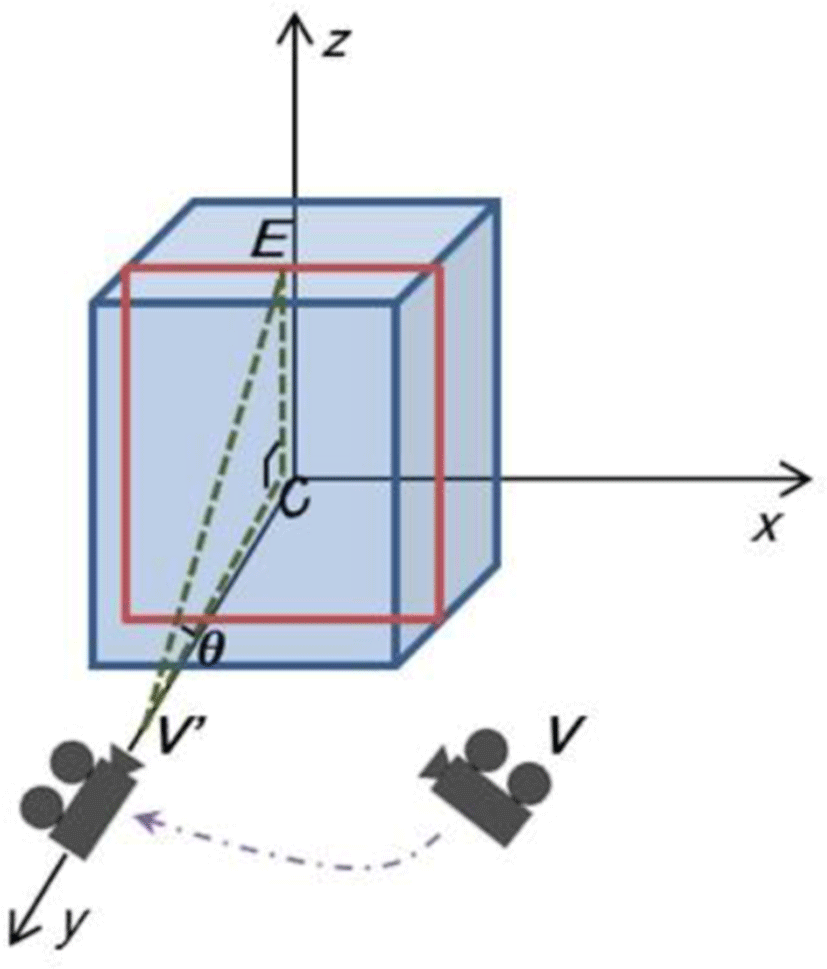
To augment spatial cues on the SOI in the same view-point as the user, we align the random view-point (V) of the user with the cross-sectional view (V’) of the SOI, (see Figure 3). The right-angled triangle, (the dotted green lines), consists of V’, the center of the SOI (C), and the middle of the upper side of the SOI (E) and it is used for the alignment. Since the angle, θ, between EV’ and V’C is constant, in this example with the degree set to 25, and the 3D coordinates of C and E are known, the 3D coordinate of V’ is calculated according to:
Note that the longer side of the SOI is used for the calculation and the alignment is optional.
We adopted the concept of opacity accumulation of ‘volume ray-casting compositing algorithm’ [4] to compute the occlusion information derived from voxels in front of the SOI. Each pixel from the SOI casts a ray to a view-point, and the ray is terminated when the accumulated opacity reaches a threshold (fixed to 0.5). The 3D coordinates of the terminated rays are used as the level of the occlusion depth. We then built a histogram, which represents the distribution of the occlusion depth, called occlusion depth histogram. To identify what bin (depth) can become the representative of the histogram, we used the concept of histogram percentile. A percentile is a measure that shows what percent of the total frequency scored below that measure. There is no universally accepted definition of a percentile, but we adopted the most common equation, linear interpolation of the two closest bins [23]. Finally, we defined depth D, as the distance between the representative bin derived from a certain percentile and the SOI.
An opacity weight curve is calculated based on the D. The curve we adopted was a logistic curve [24], which is a type of a sigmoid function (‘S’ shape). Figure 4 shows how the D is related to the generation of the logistic opacity weight curve.
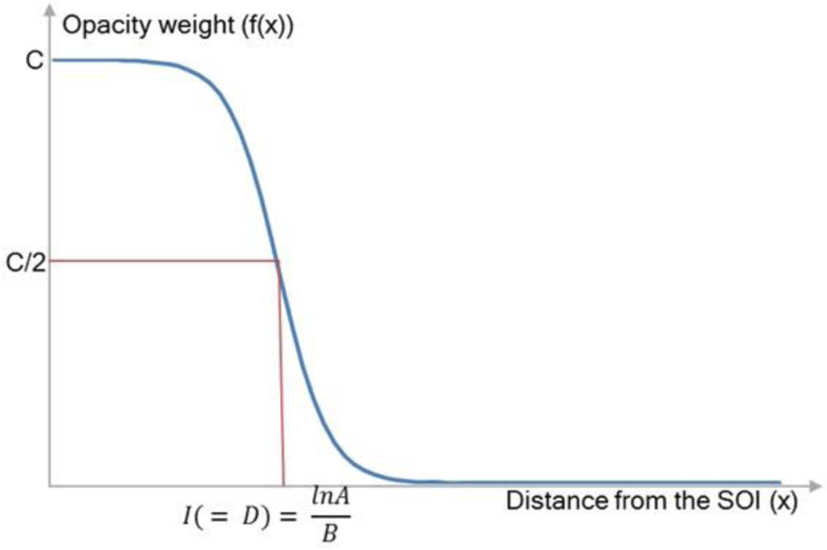
The three parameters of the logistic function equation, which are A, B, and C, work together to produce its characteristic behavior. C represents the limiting value of the output; A is the number of times that the initial value must grow to reach C. The parameter B is much harder to interpret exactly. Simply, if B is positive, the logistic function will always decrease, while if B is negative, the function will always increase. B can be calculated using the inflection point, I. The coordinates of this inflection point is known: because of the symmetry of the curve about this point, it must occur halfway up the curve at height y = C/2. Setting y equal to C/2 in the formula yields I = lnA/B; B is derived by lnA/I. The shape of the logistic curve is highly affected by the location of I where the D is localized. Our weight range is 0.999 to 0.0, and thus C and A are derived as 1 and 0.0001. Lastly, B is calculated according to the D. The generated curve is used in the way which highlights the structures before the D and de-emphasizes the structures after the D, in the following step.
To modulate the optical contribution of the voxel based on the depth distance to SOI, we integrated the weight curve described in 3.4 to the volume ray-casting compositing equation as following:
where ci-1 is the accumulated color, ai-1 is the accumulated opacity, s(i) is the intensity value of the ith sample voxel along the viewing ray, c(s(i)) and a(s(i)) are the color value and opacity value of the ith sample point, defined by a TF, di is the absolute distance of the sample voxel to the SOI, and w(di) is the modulation coefficient from the opacity weight curve. Volume ray-casting was performed in the same direction as in the occlusion depth computation, which was followed by blending with the SOI. As described in 3.1 the blending ratio is equal.
IV. IMPLEMENTATION
Real-time performance for our ODAS was achieved by using the programmability and massive parallelism of the modern GPU within a volume rendering framework available in Voreen library [25]. Voreen is an open source texture-based volume rendering library that allows interactive visualization of volumetric data sets with high flexibility for integrating new algorithms and optimizations. Figure 5 shows how to compute the occlusion depth map and histogram in GPU side. All renderings in this paper were performed on a PC with an nVIDIA GTX 590 1.5G GPU; Intel i7 CPU @3.20 GHz; running 64-bit Windows 7.
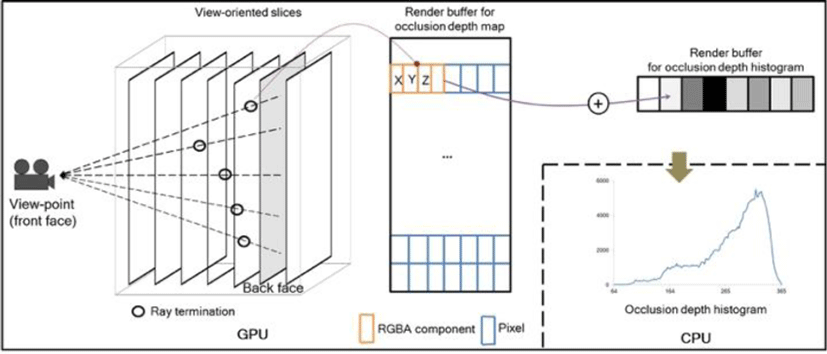
To generate the occlusion depth map, a 2D SOI was used as a new back-face for volume ray-casting. Fragment shader was used to cast rays from this back face to the front face of the view-point and it accumulated opacity values of the voxels along the rays. Once the accumulated opacity reached the fusion ratio of 0.5, the ray-casting was terminated. The 3D coordinates of the terminated rays (see black circles) were then transferred to its corresponding color components in a graphical rendering buffer that was read back to the CPU via x-y-z to r-g-b mapping.
For fast generation of the histogram, we computed the scattering operations with vertex texture fetch capabilities in the GPU to scatter the pixel points to the bins in the histogram as in the work of Scheuermann and Hensley [26]. Here, the occlusion depth map as a 2D texture was initially loaded where each of the pixels contained the 3D coordinates of the ray termination. Point primitives were generated by the vertex shader, one per pixel, which were then translated to the corresponding bin in the 1D histogram. Here, the bins corresponded to one of the 3D coordinates representing the occlusion depth. Using hardware-supported blending, all the contributions for the 2D texture were accumulated, and the 1D histogram was transferred to the CPU by reading the screen area of a rendering buffer of size 1 x N, where N is the number of bins.
V. DATA SETS
We used publically available medical image data sets: four CT studies from Osirix [27]; a lung cancer image volume from the Lung Image Database Consortium (LIDC) [28]. From the Osirix CT data, the CARCINOMIX rendered in Figure 1 and 2 had 512x512x437 at 0.711x0.711x1.5mm; BREBIX used in Figure 6 and 7 had 512x512x394 at 0.664x0.664x1.0mm; COLONIX used in Figure 8 had 512x512x326 at 0.851x0.851x2.727mm; and MANIX in Figure 9 had 512x512x460 at 0.488x0.488x0.7mm. The LIDC image used in Figure 10 consisted of 471 slices at 0.624 mm thickness with the slice of 5122 at 0.703 mm2. The intensity ranges among all images were all mapped to 12-bits.
VI. RESULTS AND DISCUSSION
We present a gallery of results from the application of our ODAS to various medical image volumes and highlight its ability to augment additional 3D spatial cues to the SOI. Comparisons to the conventional DVR, with manual clipping of the volume, are made where applicable.
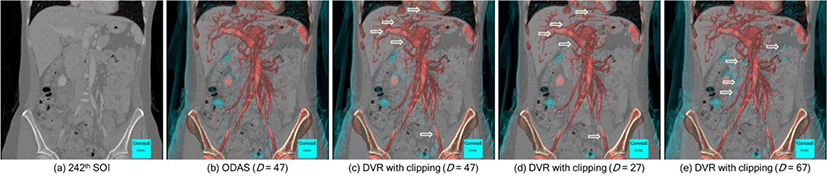
Figure 6 presents the result of our ODAS compared to the conventional DVR with volume clipping at various levels of depth. In (a), a CT study of arterial and venous abdominal angiography is shown and used as an example. Here a suitable visualization is to focus accurately on depicting the characteristics of these vascular structures throughout the body. (b) is the rendering with ODAS with D = 47 calculated and the application of the dynamic opacity weight curve function. We used a TF definition set to highlight the vascular structures and the bones, with strong augmentation on the liver and the spine; the TF setting can be readily adjustable to make them to be more visible. In comparison with the volume clipped DVR in (c) where equal D was used, we can see that the vessels are more easily identifiable and visible in (b) with the arrows in (c) indicating missing vessels when compared to (b). It is important to note that with ODAS, no volume is clipped and D is only used to calculate the weight function for the TF. (d) shows the DVR with thinner depth (D−20) from the SOI and as expected, the vascular structures in the liver (arrows in (d)) are less visible, suggesting that too much volume has been clipped. (e) shows that thicker depth (D+20) resulted in the rendering of non-relevant colons that causes occlusion to the vascular structures on the SOI (arrows). The results from (c) to (e) demonstrate the importance of selecting the right depth for volume clipping where manually identifying D is difficult task which involves tedious tweaking of the slice position until a desired visualization is met. Our ODAS, on the other hand, is able to guide a depth covering the visibility of the relative information to the SOI by analyzing the histogram representing the distribution of the occlusion of every pixel of the SOI.
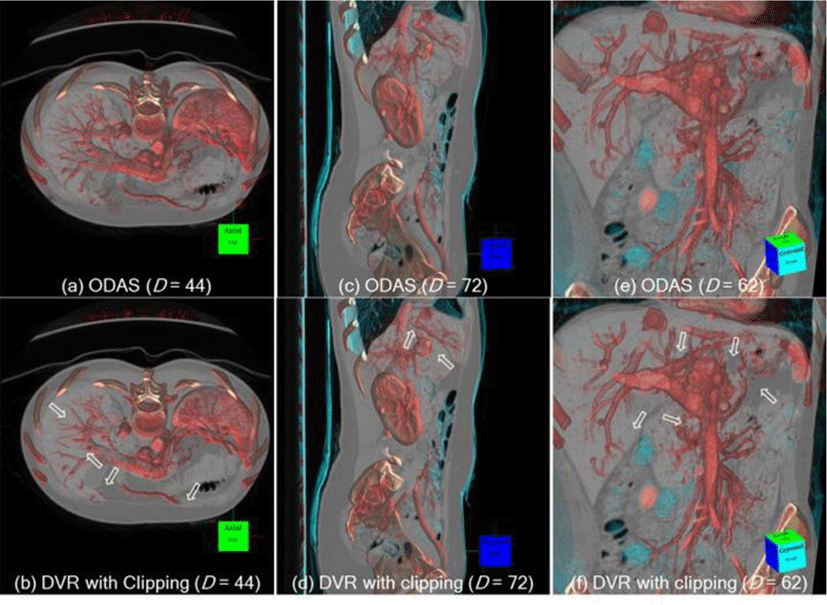
Figure 7 further exemplifies the advantages of ODAS in comparison to DVR volume clipping in various viewing angles (multi-planar). Here, the same D was applied using axial, sagittal and arbitrary views. For all these views, the ODAS was able to better preserve the visibilities of the structures that are close to the SOI (see the arrows), e.g., the vascular structures in the liver are depicted in greater
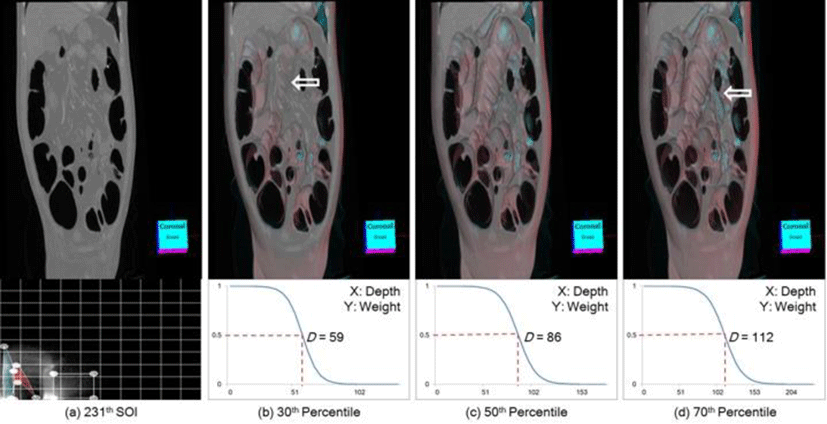
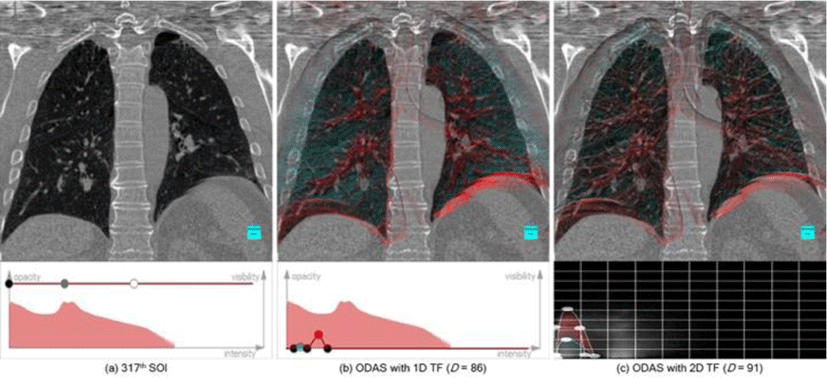
The dynamic opacity weight curve generation in the ODAS is shown in Figure 8 with a human colon CT volume. The TF for this volume assigns high opacity to barrel while allocating bones to minimum opacity to avoid occluding the view of the SOI. Depending on the percentile, the D and also the opacity weight curve are dynamically generated (see the second row), e.g., 50th percentile resulting in D = 86. We can see that the image with 30th percentile in (b) resulting in D = 59, is missing some of the colon structures, as indicated via an arrow, when compared to (c). At 70th percentile, non-relevant organs are introduced which causes occlusions to the SOI (arrows). In our study, we used a fixed value of 50th percentile for all experiments.
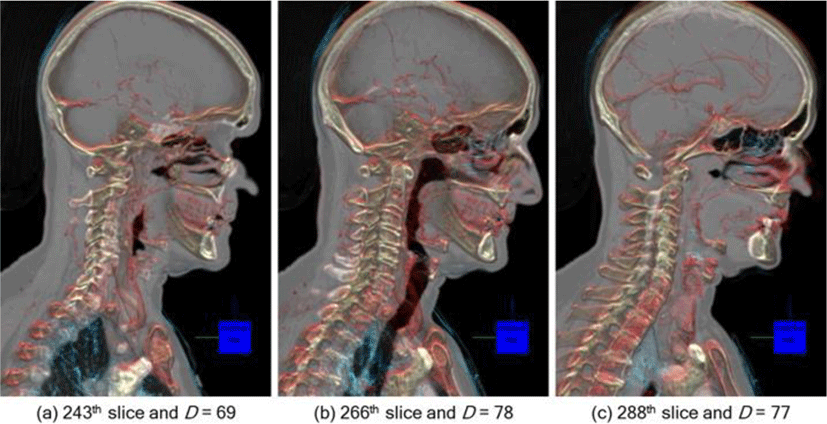
In Figure 9, we present an example scenario of how ODAS can be applied in imaging interpretation that involves the user navigating through the 2D image slices in the image volume (back and forth). During the navigation, D and opacity weight curve are dynamically calculated and the resultant rendering visualizes only the structures that are most relevant to the SOI. Depending on the slice number, D is calculated and different structures e.g., lung tissues and bone structures in (a) and blood vessels and bone structures in (c) are augmented on the slices, thereby optimally depicting the relevant spatial cues to each of the SOI.
Figure 10 illustrates a comparative result from two types of TFs with a 1D intensity-based TF in (b) and intensity-gradient-based 2D TF in (c). A high resolution computed tomography (HRCT) image volume is rendered with the TFs defined to highlight the cartilaginous bronchi and trachea (see the second row of (b) and (c)). With the intensity-gradient 2D TF, we can better differentiate the passageways (red) and isolate the lung boundary (blue) from other tissue types, which is not possible in 1D, and thus resulting in a superior augmentation of those structures on the SOI. Nevertheless, in both TFs, we note that the augmentation of relevant structures to SOI provides additional spatial cues with the ODAS.
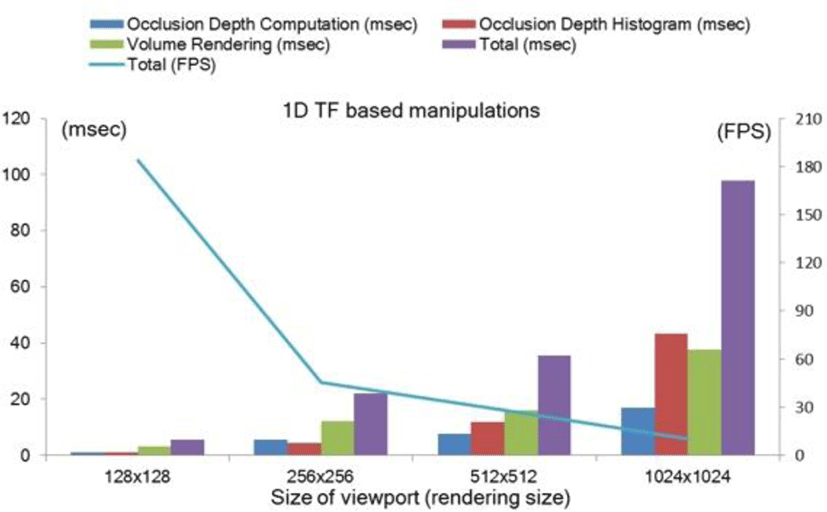
Figure 11 plots the average computing times, in frames per second (FPS), during typical ODAS visualizations including rotations, panning, and TF manipulations. For these measures four different rendering sizes from 128x128 to 1024x1024 were calculated. Further, the computation required for the three main processes in the ODAS, namely the occlusion depth computation, depth histogram generation, and DVR algorithm are also plotted. Even in the high resolution (1024x1024) rendering viewport, our implementation achieved an interactive rate of > 10 FPS. Computation with 2D TF resulted in the reduction to 11.84 FPS from 28.11 FPS in 1D TF at 512x512 viewport size. This is as expected where the application of gradient-based 2D demands greater computation due to its real-time gradient computation.
VII. CONCLUSIONS
In this study, we presented a new visualization algorithm which introduced the concept of dynamic opacity weight curve generation from the estimation the occlusion from the voxels (structures) residing in front of the SOI. Our results demonstrated that our algorithm that rendered the DVR together with the opacity weight curve was able to augment valuable 3D spatial visual cues to the SOI while avoiding the occlusion of the SOI.