


I. INTRODUCTION
Nowadays, there was significant development in the field of Intelligent Big Data (IBD) analysis where a multicore platform based on a large computing cluster was used. Despite the improvement, too much complex information is still being provided for a single institute or a computing center for processing. Especially, the number of multimedia and user population will increase continuously and exponentially due to the rapid spread of smartphones and social networking sites [1].
According to World confederation for Physical Therapy (WCPT), Physical therapy is about relieving damage and functional limitations with planned, helpful, and adjustable therapeutic interventions. It also includes the stamina, health and quality of life for people of all ages. like this, physical therapy is a treatment that can be treated regardless of age or sex for various reasons that are restricting the body. The coverage of physical therapy is also very diverse. Physical therapy can be applied in a variety of fields such as orthopedics, neurosurgery, pediatrics, gynecology, thoracic surgery and dentistry. in particular, physical therapy by orthopedic accounts for the largest portion.(2008) among the health insurance benefits claims for the 22 major diseases, the disorders of the digestive system (23.40 million cases) and the ailments associated with skin & subcutaneous tissue (over 12.00million+ cases) were the highest.
Besides these two, the incidents of diseases pertaining to the musculoskeletal, nerve, and circulatory systems, as well as the congenital deformities and the genito-urinary diseases are continuously occurring [Fig. 1-2].
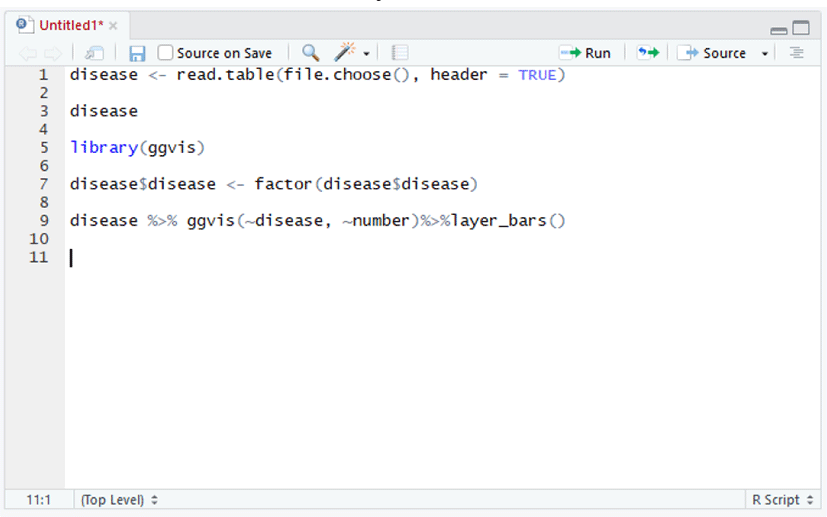
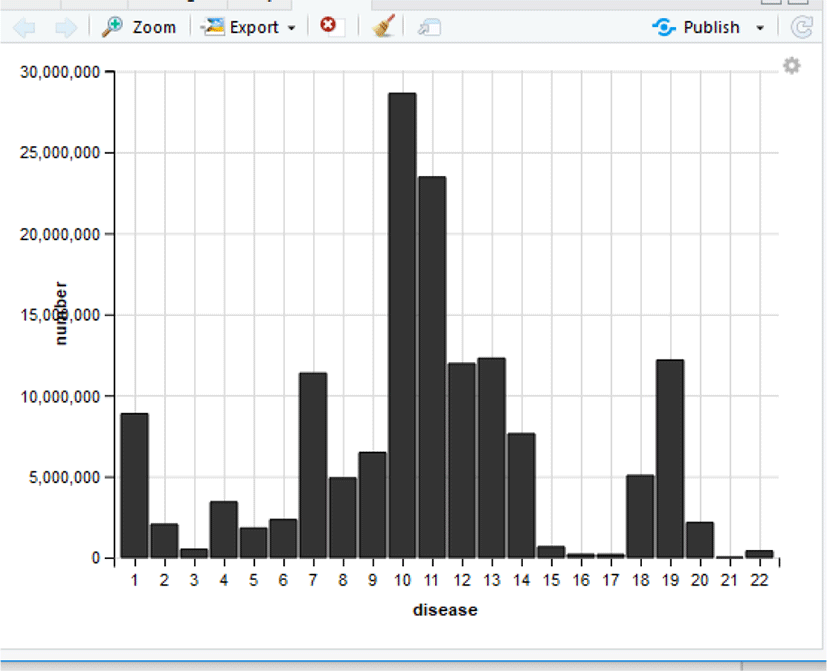
In Fig. 2, No. 10 and 11 are of the disorders of the digestive system and the ailments associated with skin & subcutaneous tissue. It also shows that many other diseases have occurred additionally.
Table. 1. is a public Big Data of the health care system including the health insurance sample cohorts collected by the National Health Insurance Corp., the patient dataset managed by the Health Insurance Review & Assessment Service, and the public health & nutrition survey conducted by the Korea Centers for Disease Control and Prevention. Big data is being utilized by such healthcare organizations so that it is expected that enough big data can be collected in the physical therapy field.
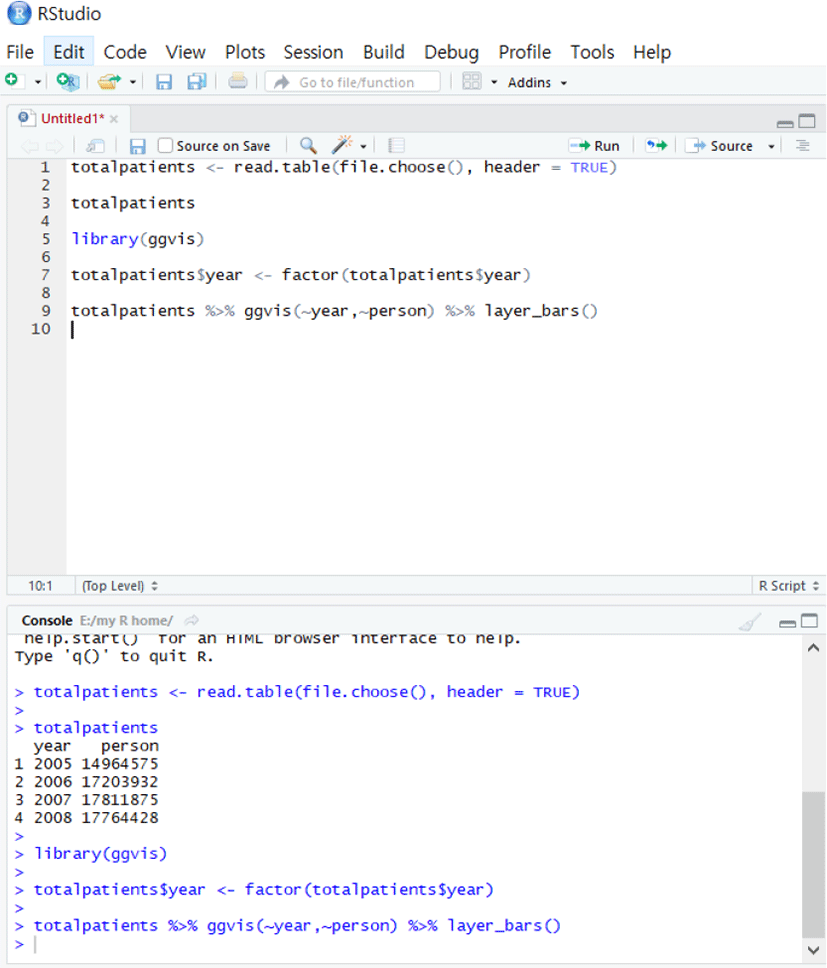
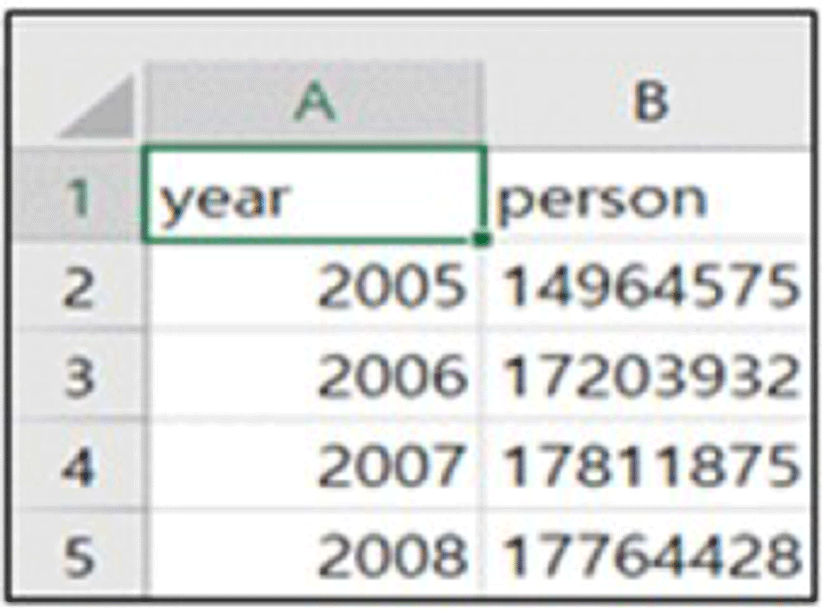
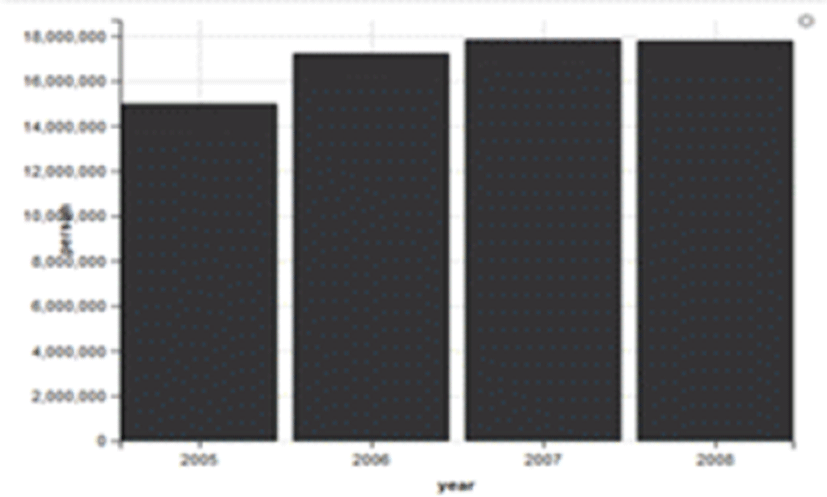
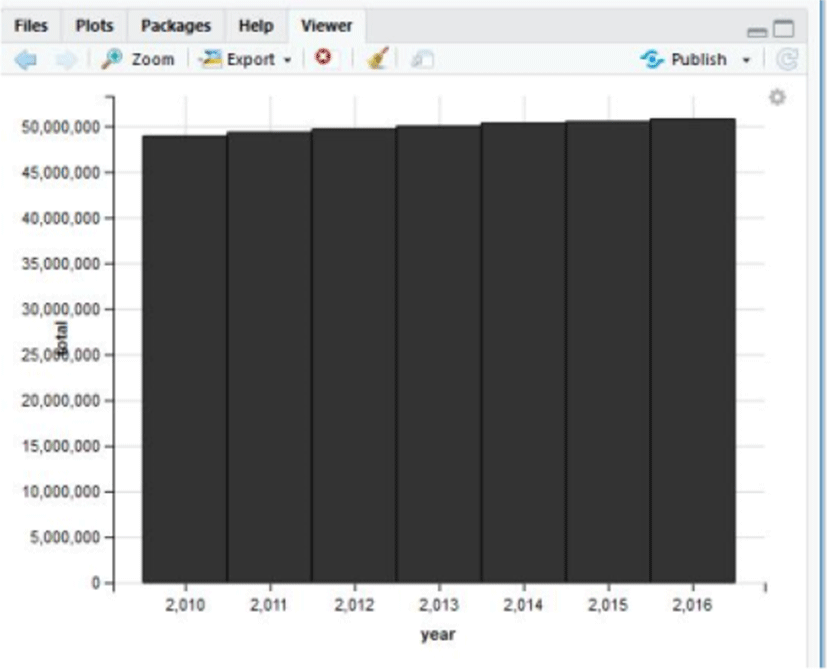
On the basis of the health insurance subscribers of the Republic of Korea (ROK), the number of patients requiring physical therapy has exceeded 17 million [Fig. 3, 4 & 5] and it is estimated that the number has increased recently. On this basis, an attempt was made to engraft the concept of big data into such a content.
II. RELATED WORK
Accordingly, the market for the big data is becoming larger over time and the data is being used in different areas of our daily lives and much information is shared by the general population. However, since the analysis of big data is very complicated and difficult that sometimes it is quite hard to recognize its meaning and direction, the visualization of big data has come into the picture. Recently, the big data analysis is shifting from AMOS to R/TensorFlow [2].
Machine learning (ML) refers to studying various methods of achieving human-like learning ability through machines, and from the data analysis results, the program can learn about rules or new knowledge by extracting them automatically by itself. The techniques related to machine-learning remaining at the basic level is now becoming more sophisticated due to the emergence of new data mining techniques which can maximize their potential. Recently, ML is one of the major areas of interest for the artificial intelligence systems, being at the intersection of informatics and statistics and closely related to the data science and knowledge discovery as well as the healthcare industry [3-4]. Especially, probabilistic ML is quite useful for the health informatics where most of the problem-solving process involves removing of uncertainties. The theoretical basis of the probabilistic ML was initially laid by Thomas Bayes (1701–1761) [5]. The probabilistic inference holds a key position in artificial intelligence and statistical learning where the inverse probability allows one to infer unknown facts, deducing them from the available data and making predictions [6-7].
Meanwhile, the scale of big data is much larger than that of the data generated from the analog environment of the past, shorter in generation cycles, and not only the numerical data but the character and image data are included in the big data as well. Since the use of PC, internet, or mobile devices has become part of people’s daily routine, the volume of data left behind by them is increasing rapidly. Along with the fact that the volume of big data has increased explosively, the types of data have been also diversified such that people’s behaviors, as well as their thoughts and opinions can be anticipated through positional information and SNS services. Many countries and companies are attempting to construct and utilize the big data system now. Accordingly, the market for the big data is becoming larger over time and the data is being used in different areas of our daily lives and much information is shared by the general population. However, since the analysis of big data is very complicated and difficult that sometimes it is quite hard to recognize its meaning and direction, the visualization of big data has come into the picture [8]. Wu et al. [9] have argued that a large volume of data (big data) can be problematic when frequent itemset mining has been used for the following reasons: (1) spatial complexity: the algorithm may not be run as the system memory deal with a large input data as well as large intermediate results and output pattern; (2) time complexity: many existing approaches depend on an exhaustive search or a complicated data structure to obtain a frequent pattern but this is not suitable for big data. Thus, they proposed an iterative sampling-based frequent itemset mining that samples the subsets instead of processing entire dataset all together and then extracting the frequent itemsets from them. Yang Luo et al. [10] maintained that segmenting the Left Ventricle (LV) from the cardiac MRI image is essential when computing the clinical indices such as stroke volume, ejection fraction, etc. Thus, in this study, an automated LV segmenting method where the hierarchical extreme learning machine (H-ELM) is combined with a new location recognition method is proposed [1]. Big Data is not a new concept but refers to a massive data which exceeds the existing range of data storage, management, or analysis system can deal with, such as Relational Database Management System; RDBMS), etc. (J. H. Lee et al. 2014) [11-12]. Also, S. W. Cha (2014) noted that the technological characteristics of big data are high volume, high variety, and high velocity in terms of volume, variety, and velocity, respectively [13].
As such, it can be considered that big data is highly correlated with physical therapy on the basis of a large number of patients (high volume), a wide range of application (high variety), and the rapid increase in the number of patients (high velocity).
The proportion of the ROK’s senior citizens over 65 reached 7.2% in 2000, which was then increased to 13.5% in 2016, approaching 14% satisfying the UN’s definition of ‘aging society’ (H. J. Kang & G. H. Lee, 2017) [14]. Although the R-studio-based statistics did not indicate a large increase in the Korean population, it is evident from the fact that the rapid increase in the number of senior citizens is the evidence of becoming an aging society.
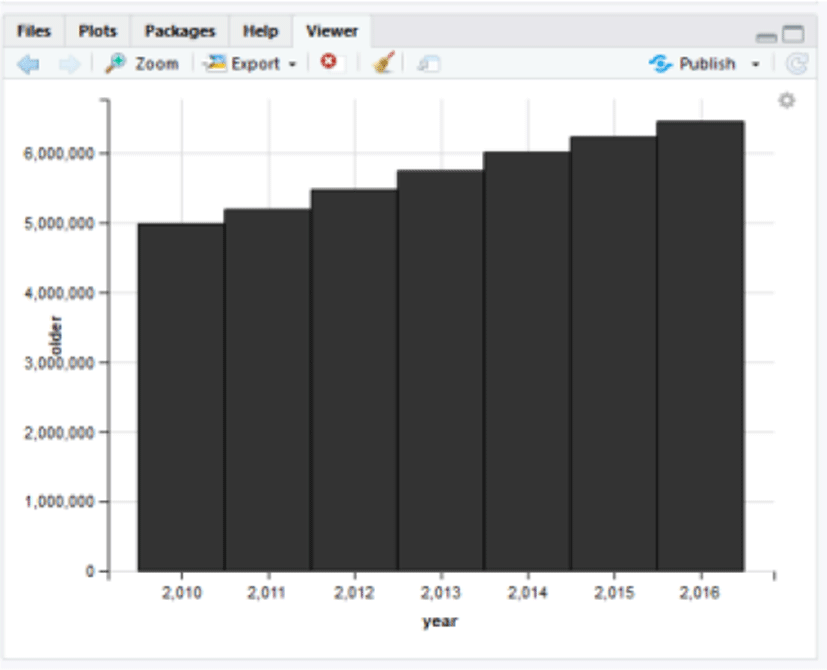
For these reasons, the aging population will be at the risk of being exposed to a variety of diseases as they get older and the number of their visits to a hospital will be increased. The only currently available significant statistics of physical therapy-related data is one that has been compiled by the National Health Insurance Corp. from 2005 to 2008. The same type of statistics has not been compiled for over 10 years now so that it would negatively affect the development of physical therapy. Thus, if an application based on the physical therapy big data is developed, the statistics will be taken actively and ultimately, the therapy itself will be improved in efficiency and quality.
III. Design of Physical Therapy-Based Application
Observing the result of classification by risk types using a big data, the biggest risks are legal or institutional risks which occur frequently and have a specific issue of breaching one’s privacy (S. O. Yoon, 2013) [15]. Additionally, according to Article 2 of the ROK’s Privacy Act, the personal information is being defined as the information of a person which can be recognized through his/her name, resident registration number or images, including the information which by itself cannot be used to identify a person but can be combined easily with other information for identification. In this regard, the physical therapy big data may breach one’s privacy or expose the details of the therapy and thereby resulting in a breach of the Privacy Act. Therefore, the most important part when developing an application based on the physical therapy big data is obtaining a patient’s consent on sharing his/her personal information. Also, following Item 4 of Article 4 (Rights of Data Subject), the application will allow the patients to demand their information to be stopped from processing or revise/delete/destroy it afterward even if they have given their consent so that the users of the application will be free from the concerns of personal information leak.
The method of obtaining a consent from the user is by asking it on the first screen when starting to download the application.
The name of this application is AOPT which stands for All of Physical Therapy and the initial screen is shown in Fig 1 where the user’s consent for sharing his/her personal information will be being asked. After obtaining the consent, the starting screen will collect the personal information including the types of diseases, gender, and age which are necessary for creating a physical therapy big data.
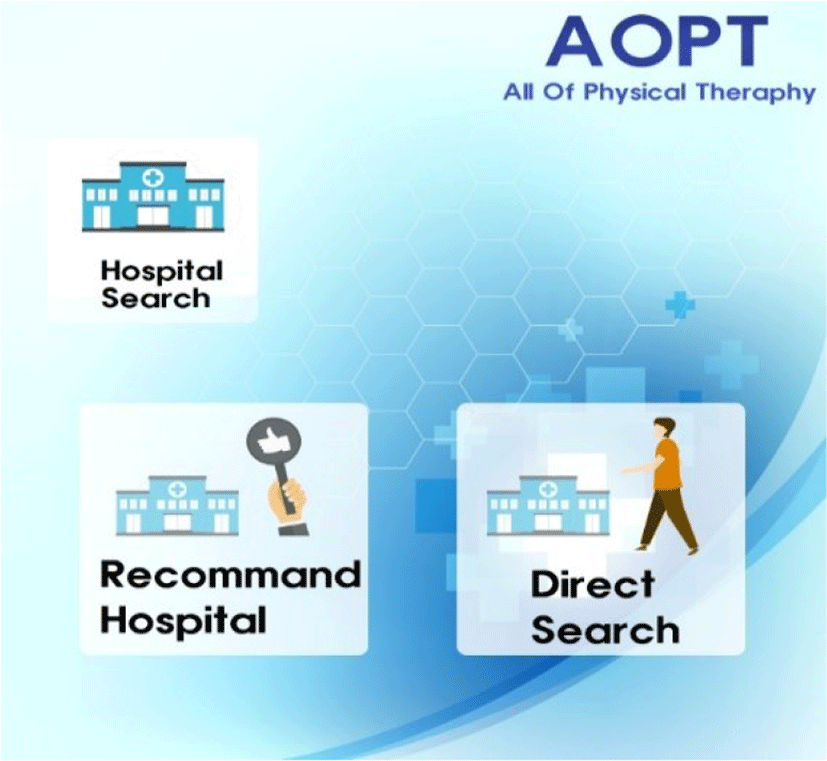
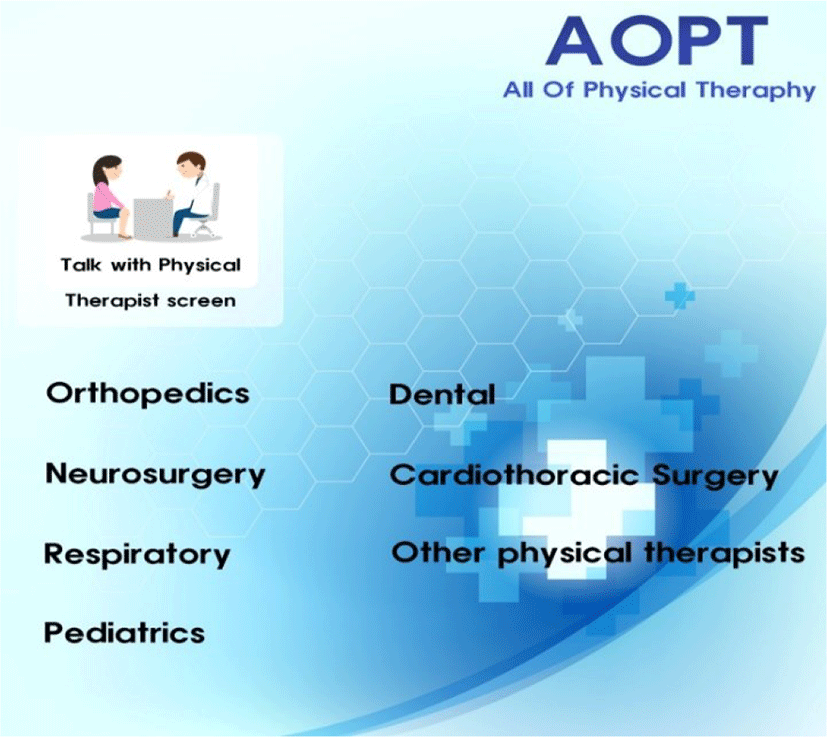
The main screen will be composed of Physical Therapy Report, Complaint-Type Search, Recommended Workout, Hospital Search, Talk with Physical Therapist, Community, and My Page.
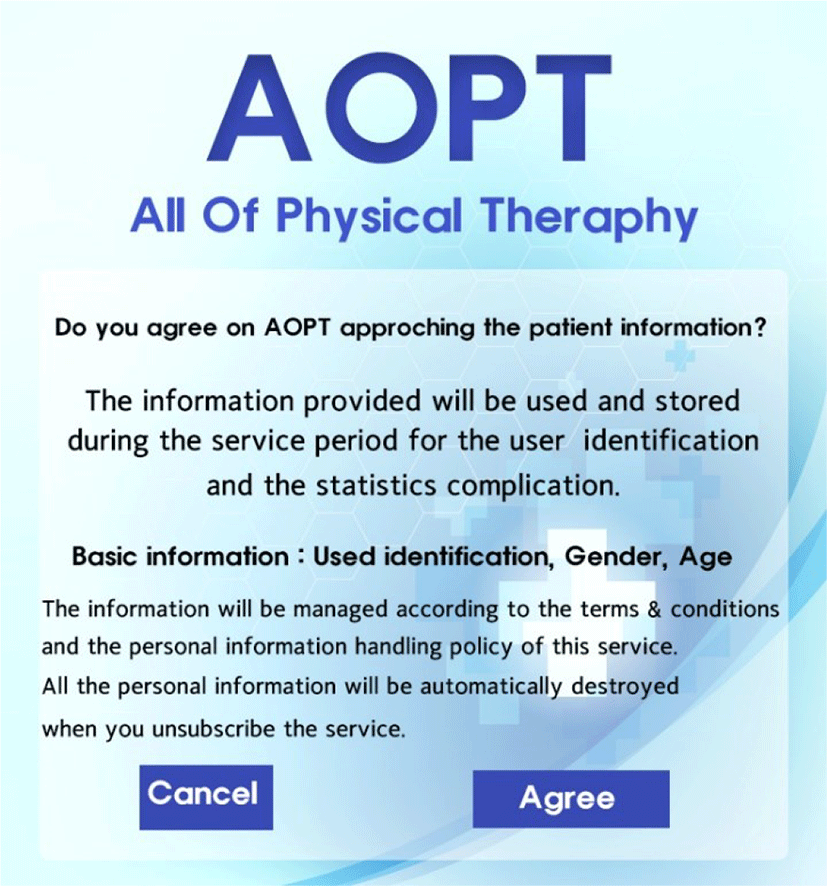

Fig. 10. is showing Physical Therapy Report where the total duration of the patient’s physical therapy, number of treatments, and the parts of the body being treated during his/her entire life will be statistically compiled and used for the generation of a physical therapy big data.

Fig. 11 is showing Complaint-type Search with which a patient can search for his/her complaint about a certain symptom other than the main area(s) of treatment. In this step, a big data entered by the user will be used to infer the disease based on the symptom.

Meanwhile, Fig. 12 shows Recommended Workout which recommends the self-workouts that can be performed at home after receiving a treatment according to the symptom.

Talk with Therapist in Fig.13. will be able to recommend the hospitals based on their specific physical therapy specialties considering patient’s present condition.
Talk with Therapist in Fig. 14 will allow the patient to communicate with his/her therapist(s) directly about the treatment he/she has received. The talks with the therapists the who are involved with the treatment will be systematic and professional.
Finally, My page in Fig. 15 provides a space in which the present patient is required to enter or can modify his/her age, gender, and the type of physical therapy being applied to him/her. These data will be a basis for performing a big data analysis.

IV. CONCLUSION
The application proposed in this study is highly expected to contribute to the development of physical therapy by assuming a big role in collecting the physical therapy-related big data. With this application, the patients will be apple to receive physical therapy conveniently and acquire a variety of information whereas the physical therapists will be able to develop new types of treatment techniques with which they can conduct a prompt and systematic treatment by analyzing the Big Data.