I. INTRODUCTION
One of the interesting archeological findings of Mongolia is the drawing of various motives carved or drawn on ancient rocks and statues. It has been some time since research into rock art started in Mongolia. As a result of archaeological study conducted in Mongolia, there are over 500 rock art sites identified and that number is increasing every year due to explorations [7]. There are 2 kinds of rock-drawing images Ochre painting and Petroglyphs. The ochre painting found in Mongolia are divided into three groups;
-
Animals, various signs and symbols
-
Cross signs
-
The images of birds, humans, and animals among numerous dots in square or round frames
The petroglyphs thematically classifying the rock artwork left by the ancient people has great significance to understand its meaning this includes:
-
Animals themes
-
Livelihood themes (images related to human activities)
-
Religious beliefs and funeral rite themes
-
Seals and their impression
-
Ambiguous figures
Animal, Livelihood/human activity, seal themed images, and other ambiguous figures are presented almost at all known rock art sites while the images of religious beliefs and funeral rites only occasionally occur.
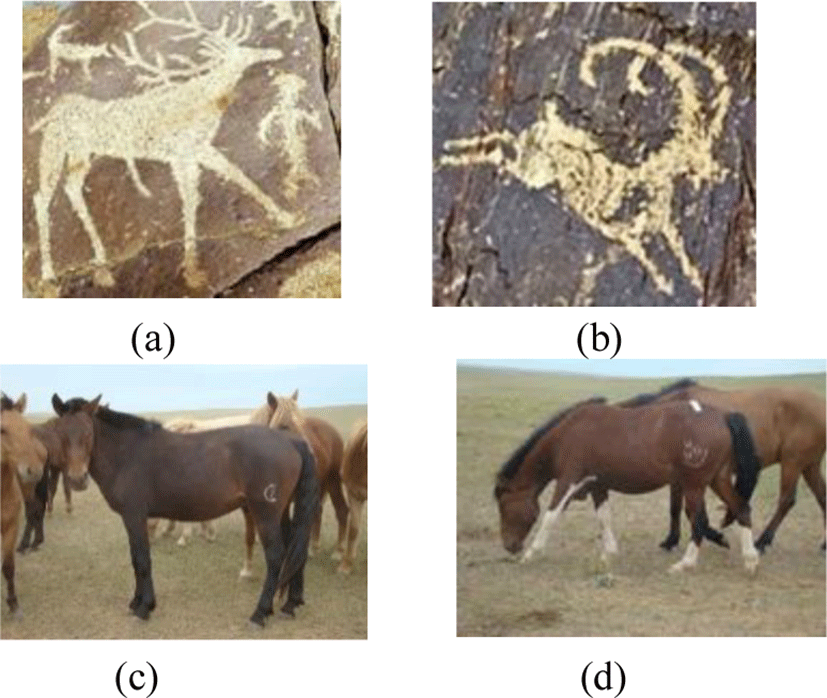
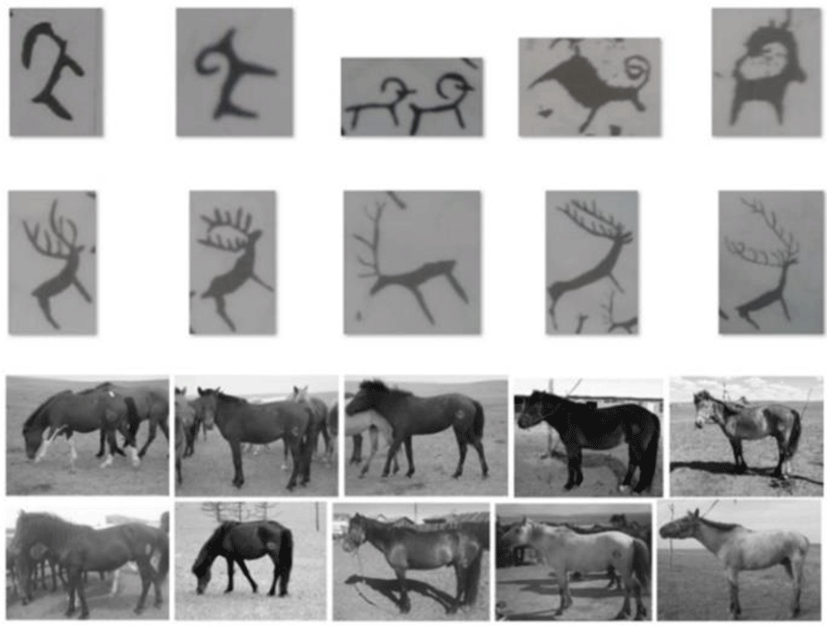
In this work our goal is to detect two kinds of the objects. One is animal’s whole body or part of body detection from the rock image. The other is stamp or owner’s sign detection from the horse image. We introduced a work that horse stamp recognition [21], that work classify the horse stamp images. That work, we used manually cropped images from horse image. Then in this time, we propose a method to detect stamp image from horse image automatically. The animal rock-images are painted with red ochre or created by engraving the rock surface (engraving the whole body of animals). The most common animals depicted are yangir (wild goat), argali (wild sheep), followed by deer, predators (including wolf, fox, etc), pigs, horse and cattle [1]. Fig.1 shows an example of rock drawing images and horse images.
II. RELATED WORKS
In general, there is no specific research using any image processing algorithms for Mongolian nomadic field images. Therefore, we reviewed two kinds of research works that one is rock classification using its color and texture [2], [3] and the other one is drawing image classification using neural network algorithms [4-6]. Leena Lepisto [2] proposed a new method with titled Color and Texture based classification of rock images using classifier combination and Geoffrey Mibei proposed an introduction to types and classification of rocks [3].
The drawing images recognition studies are introduced following researches; Recurrent Neural Networks for Drawing Classification [4], A Convolutional Neural Network in Keras Performs Best [5] and Transfer Learning for Image Classification of various dog breeds [6] show the implementation results that ability of current technologies such as deep learning methods can used art field.
Weixing Wang et al. proposed a new method with titled Rock Fracture Image Segmentation Algorithms [12]. S. Mkwelo, et al. proposed a new algorithm that Watershed-based segmentation of rock scenes and Proximity-based classification of watershed regions under uncontrolled lighting conditions for using mining applications [13].
The rock shape and defect detection and recognition studies based on the edge information are introduced following researches. Effective Adaptive Filter Scale Adjustment Edge Detection Method [14], Edge Detection in Noisy Images, Computational Statistics and Data Analysis [17], Image Segmentation Technique Used in Estimation of The Size Distribution of Rock Fragments in Mining [11] and Study and Comparison of Different Edge Detectors for Image Segmentation [10].
III. METHOD
To classify the objects from natural field images (see Fig.1), we use several classification steps and find out the best combination and parameters practically. Fig. 2 shows our system structure.

First, we have to detect object correctly, and then cropped rock-drawing objects and to classify the objects.
After detecting the objects, we loaded different sized images and resized into 20x20 pixels in grayscale value in Matlab program [8], [9]. Then we used PCA algorithm for feature extraction and tested different classification algorithms to distinguish rock-drawing images of deer from argali (wild sheep).
To detect the rock-drawing part from nomadic environmental rock images, we use several image processing steps and find out the best combination and parameters practically. Fig. 3 shows a structure of our proposed methods for object detection.
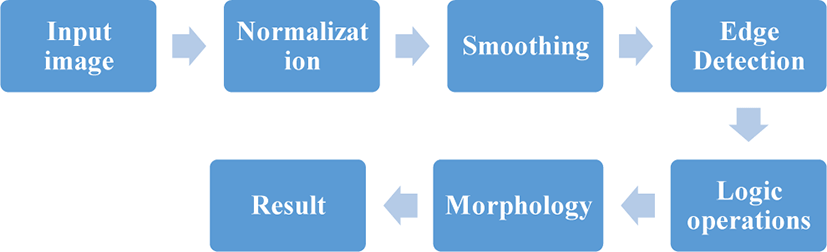
There are some noises in input images, so we used Gaussian smoothing algorithm for removing the noises. We tested 7 types of images by changing kernel size of Gaussian smooth from 3 to 15 and the best results show in the Table 1. The next step is edge detection [13] using 4 (Canny [11], Roberts, Prewitt, Log) types of popular methods and then combination of them which is implemented logical operations (and, or), select best result among all their possibilities.
| Kernel size | Rock-1 | Rock-2 | Horse-1 | Horse-2 |
|---|---|---|---|---|
| 3 | 60 | 60 | 95 | 90 |
| 5 | 100 | 88 | 98 | 91 |
| 7 | 98 | 85 | 88 | 75 |
| 9 | 100 | 82 | 78 | 55 |
| 11 | 90 | 48 | 70 | 45 |
| 13 | 80 | 40 | 60 | 32 |
| 15 | 85 | 28 | 40 | 20 |
Edge detection operator is a mutation in the nature of the image edge to test the edge. There are two main types [10]: one is the first derivative-based edge detection operator to detect image edges by computing the image gradient values, such as Roberts operator, Sobel operator [10], Prewitt operator; the other one is the second derivative-based edge detection operator, by seeking in the second derivative zero-crossing to edge detection, such as LOG operator, Canny operator.
Gradient is a measure of the function changes. And it is also the first order derivative of the image corresponds to two-dimensional function. An image can be seen as a continuous derivative of image intensity of sampling points group. Gradient [9] is a type of two-dimensional equivalent of the first derivative. It can be defined as a vector.
There are two important properties. First, the vector G (x, y) direction is same as the direction of the maximum rate of change of increasing function f (x, y) (e.g. formula (2)); Second, the gradient amplitude (e.g. formula (3));
For digital images, partial derivative of the edge is almost same as differences. The edge often lies on the differential value of the maximum, minimum, or zero.
When we calculate the gradient, the same location (x, y) of real partial derivatives is essential in computing space. Gradient approximation is not in the same location using the above formula. The 2x2 first order differential template is used to calculate partial derivatives in x and y direction of the interpolation points [x +1 / 2, y +1 / 2], then Gx and Gy can be expressed as:
After creating 4 images of edge detection, we use logical 8 combination of them simply. And we selected the best result by comparing their ground truth values.
The last step of our system is applied morphological dilating and closing operations for improving the shape clearly.
IV. EXPERIMENTAL RESULTS
We collected data 50 sample gray images from each two classes (argali and deer) of the rock drawing images. Fig. 4 shows 5 samples of the two classes and 10 images of horse with stamp.
We did experiments in the most popular two kinds of rock-drawing images.
We did experiments in the most popular rock-drawing images by changing several types of algorithms, with their combination and parameters variations. As a result, we got the best results very near to its ground truth results. Table 1 and Table 2 shows the compared results as percentage of number of bounding boxes in the image.
| Logical operations | Rock-1 | Rock-2 | Horse-1 | Horse-2 |
|---|---|---|---|---|
| &&| | 15 | 13 | 25 | 15 |
| &|& | 100 | 100 | 78 | 68 |
| ||| | 30 | 30 | 10 | 18 |
| &&& | 10 | 0 | 0 | 10 |
| |&& | 40 | 30 | 12 | 19 |
| ||& | 40 | 30 | 13 | 19 |
| |&| | 20 | 30 | 11 | 20 |
| &|| | 35 | 50 | 30 | 35 |
Figure 5 shows the results images according to their steps.
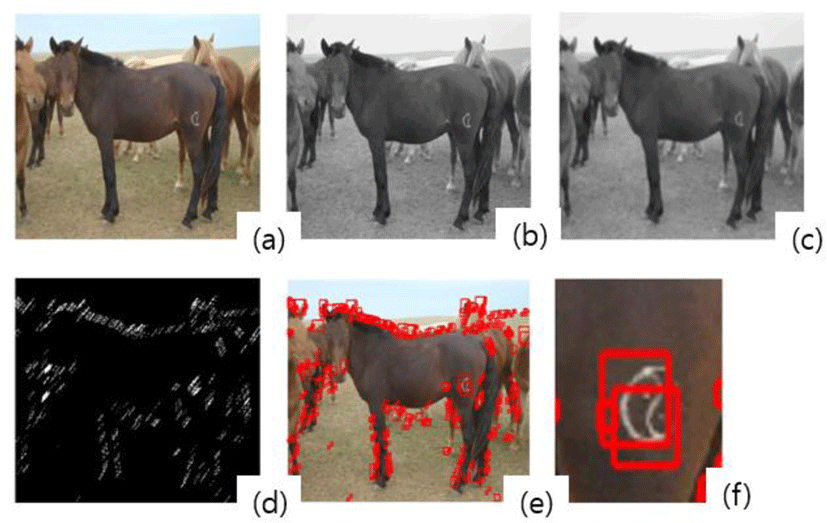
The bounding boxes show features or parts of the image objects. We estimate the results using comparison of number of correct bounding boxes and the number of total bounding boxes. The correct bounding boxes includes the feature of ground truth objects. Some bounding box do not include any parts of the object, therefore that result is error.
We compared results of proposed method with ground truth result, computed the number of correct bounding boxes by dividing the total number of detected bounding boxes (in Table 1 and Table 2). Table 1 shows the results of the different kernel size smoothing when the edge combinations are ‘and or and’ (noted &|&).
After Smoothing filter performs with different kernel sizes from 3 to 15, the kernel size of 9 showed the best result. The best result was 100, 82, 78, and 55%, respectively (in the Table 1). But in the horse images kernel size 3 was the best results. Smoothing is necessary to remove small edges in the horse hair edges and rock image’s growing grasses etc.
Table 2 shows the result of the logical operition combination of 4 types of edge detection methods' results. The best result was for 4 images ‘and or and’ ( & | & ) operations in all images with 100, 100, 78 and 68% correct results, respactively.
The detected results cropped by coordinates with minimum x, y and maximum x, y among the all detected bounding boxes.
We tested the results of detected objects using classification for 2 kinds of rock animal images argali and deer (top 2 rows in the Fig.1).
In the feature extraction part, we select several features (10, 25, 35, 50, 100 and without features extraction 400 grayscale pixels) using the PCA method. From experimental results, the best feature dimension was 25. Table 3 shows the results of the classification.
The best results were Functions SGD, k-NN, Random forest and the worst methods were Naïve Bayes Multinomial and Zero R classifier. We introduced horse stamp recognition work before [21]. Then in this time, we tested classification results only in the rock-drawing objects.
V. CONCLUSION
In this paper, we had done several experiments to detect objects from nomadic field images, in the most popular rock-drawing images and horse images by changing several types of algorithms, with their combination and parameters variations. As a result, the best in each image as follows: in rock images, kernel size is 9 and logical operations combination of edge detection results are ‘and or and’; in horse images, kernel size is 3 and logical operations combination of edge detection results are ‘and or and’.
Also, we had done several experiments to classify the rock drawing images, in the most popular 2 rock-drawing images by changing several types of algorithms, with their combination and parameters variations. Then, we use PCA method for feature extraction.
Main contribution is to detect object or object parts form nomadic environmental images using combination of several edge detection results. Using this method, it is possible to collect big data for object classification and then it is possible to deep learning methods for cultural information generation from the collected images.
In conclusion, the machine learning methods and its parameters are very sensitive from the structure and type of the rock. In future work, we will do multiclass classification among the other types of the nomadic environmental images by detecting objects. It is possible to classify objects by geographical location, historical time and any other traditional and cultural viewpoints.