


I. INTRODUCTION
Breast cancer is the most commonly diagnosed cancer and the leading cause of cancer death among women worldwide, accounting for approximately 1.7 million cases and 521,900 deaths in 2012 [1]. The American Cancer Society, in turn, recommends women over the age of 40 to get breast cancer screening mammograms on a regular basis for the purpose of early detection [2]. However, it is difficult for radiologists to detect and analyze masses due to their variation in shape, size, and boundary as well as their low signal to noise ratio, resulting in unnecessary biopsies or missed masses [3].
A computer-aided diagnosis (CAD) system has been traditionally used in breast mass classification. However, according to one study on the effectiveness of CAD, it shows no significant improvements in the sensitivity for invasive breast cancer [4]. To solve this problem, convolutional neural networks (CNNs) based on deep learning approaches are being developed by many researchers to be used in clinical practice. Unlike traditional CAD systems that use pre-determined features, CNNs determine the most relevant features from data in order to classify images as normal tissue or malignant masses [5].
A CNN commonly includes the convolutional layers, the pooling layers, followed by fully connected layers. The convolutional layers consist of a set of learnable filters that are convolved with the input image. The pooling layers reduce the size of the input and max-pooling is commonly used. Fully connected layers have full connections to all activations in the previous layer and calculate the final output with a soft-max function [6].
II. MATERIALS AND METHODS
The mammogram data set used in this study was obtained from 340 breast cancer cases. Each case included both the mediolateral oblique (MLO) and craniocaudal (CC) views of each breast, as well as 400 normal tissue and 319 malignant mass square regions of interest (ROIs). During the process, unclear data, such as images with masses all over the breast and mammograms taken while breastfeeding, were taken out. These images were then split into training, testing and validation data respectively 60%, 20% and 20%.
Due to the small size of our dataset, data augmentation was performed by rotating the original images 90°, 180°, and 270° and flipping the same images horizontally and vertically. Since masses do not have a particular orientation [3], rotated and flipped images were recognized as different images from the original ones. Data augmentation resulted in the data size 6 times larger than the original dataset comprising 2400 normal and 1914 malignant masses.
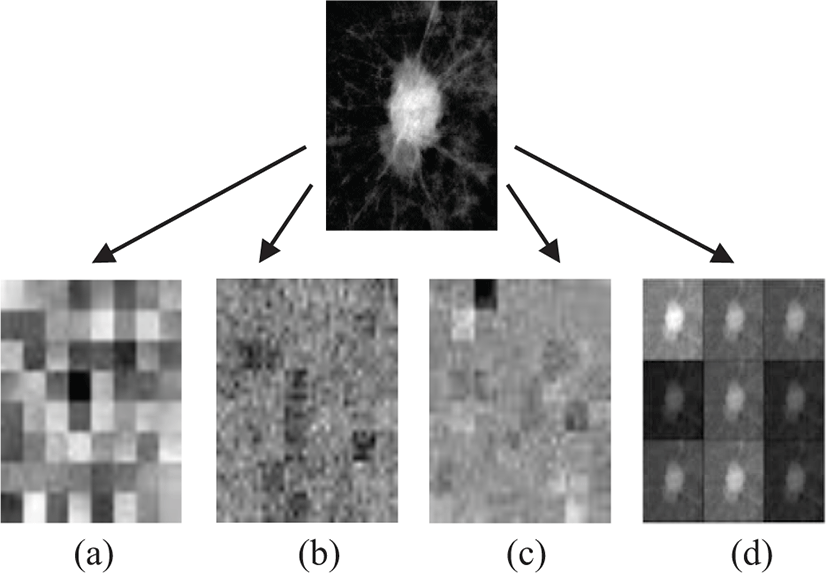
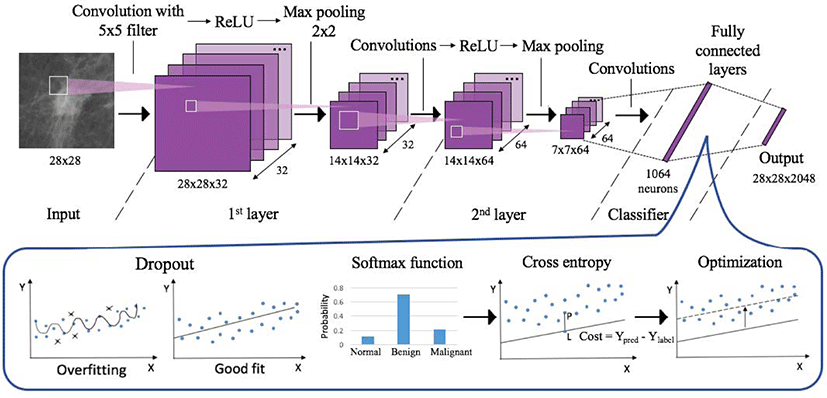
A visual representation of the two layered CNN architecture used in this study is shown in Figure 3. It consists of 3 stages of convolutional layers, ReLU (rectified linear unit) activation layers, and max pooling layers, followed by fully connected layers. A dropout layer with dropout factor of 0.75 was added before the fully connected layers to prevent overfitting [7]. Examples of mammogram images at the low-level, mid-level, high-level features, and a convolved image are also shown in Figure 1.
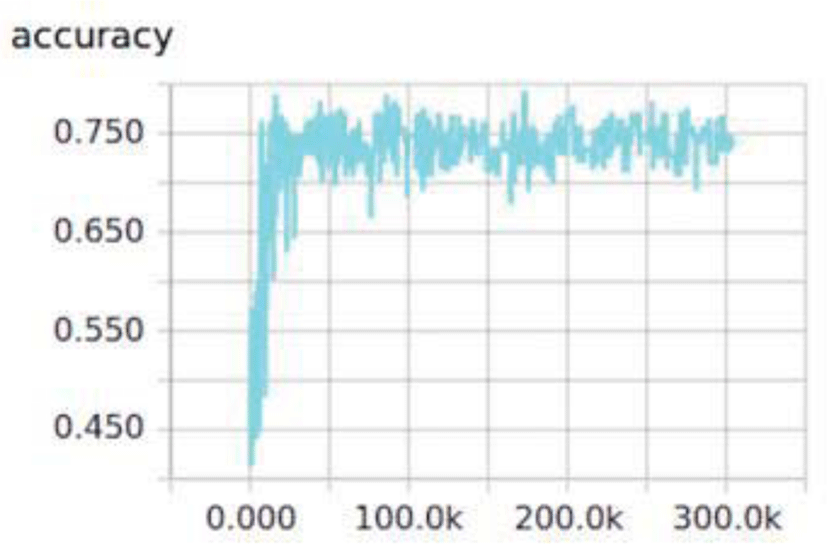
In addition, optimum number of iterations had to be determined since a small number of iterations results in less training and too large a number of iterations results in high error rates. Observing the iterations vs. accuracy graph in Figure 2, it was confirmed that to keep increasing the number of iterations does not further increase the testing accuracies. Therefore, the number of iterations was set to 50,000 where the curve reached a plateau, and the batch size was set to 30 for all datasets.
Each filter or kernel in convolutional layers extracts particular features from the images. Before the number of filters was increased, the model used 32 filters in the first convolutional layer and then 64 filters in the second layer, extracting 2,048 features from one image. The number of convolutional filters was then increased to 64 and 128, to see if it enables the model to extract more features and show better performance.
Since the CNN model used in this study was modified from MNIST classification model, 28 by 28 was the default setting that could be used as input image sizes. To see if increasing image sizes enables the network to extract smaller and more detailed features and ultimately to show better performance in breast mass classification, input image sizes of 64 by 64, 128 by 128, and 256 by 256 were compared.
Adam (Adaptive Moment Estimation) optimizer was applied to the model instead of RMS optimizer to see if it is more suitable for minimizing the loss function. RMS optimizer applies the same learning rate for all parameters while ADAM optimizer computes individual adaptive learning rates for different parameters. Also, it only requires first-order gradients with little memory requirement [9].
III. RESULTS
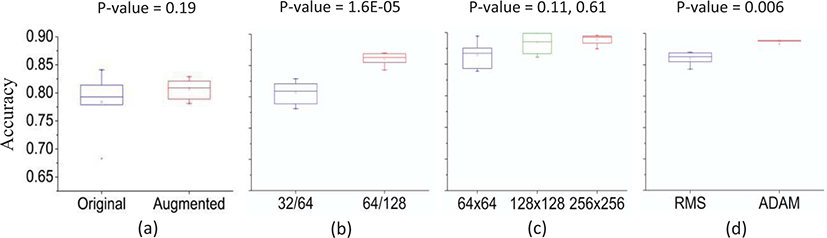
Mass classification was performed using 4 variables explained above. With 400 normal tissue and 319 malignant mass ROIs, the testing accuracy was 0.78, the sensitivity was 0.88, and the specificity was 0.67. Data augmentation resulted in the data size 6 times larger than the original dataset comprising 2400 normal and 1914 malignant masses. The accuracy was 0.81 with the sensitivity of 0.80, and the specificity of 0.82. Also, a t-test was performed and the p-value was 0.19.
With 32 and 64 convolutional filters, the testing accuracy was 0.81, the sensitivity was 0.80, and the specificity was 0.82. Increasing the number of convolutional filters to 64 and 128 resulted in the accuracy of 0.86, the sensitivity of 0.84, and the specificity of 0.89. For increasing image sizes, the accuracy with 64 by 64 input image sizes was 0.86. When they were increased to 128 by 128 and 256 by 256, the accuracies also increased to 0.88 and 0.89. T-test results between image sizes 64 by 64 and 128 by 128 produced a p-value of 0.11, and a p-value of 0.61 was shown between image sizes 128 by 128 and 256 by 256.
Mass classification with a RMS optimizer resulted in the accuracy of 0.86, sensitivity of 0.84, and specificity of 0.89. When the optimizer was changed to ADAM, the accuracy was 0.89, the sensitivity was 0.90, and the specificity was 0.87. A t-test was performed and the p-value was 0.006.
In conclusion, the best classification performance showed an accuracy of 0.887, sensitivity of 0.903, and specificity of 0.869 for normal tissue versus malignant mass classification with augmented data, more convolutional filters, and ADAM optimizer.
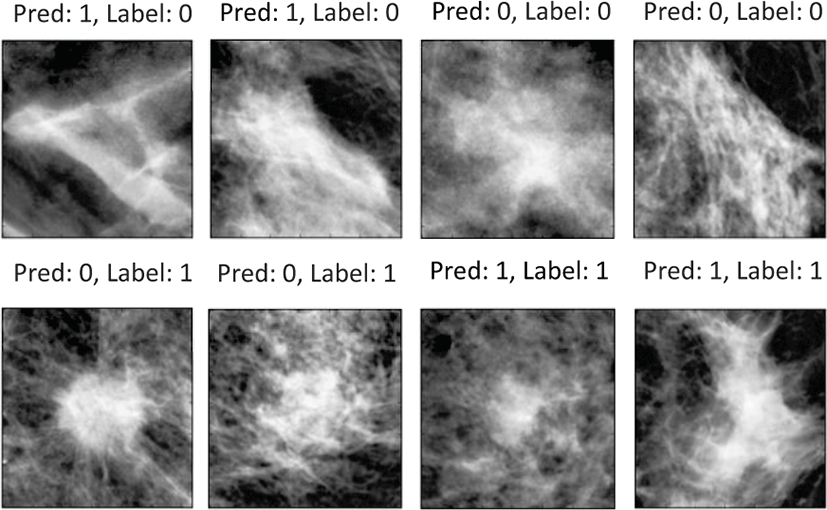
Sample output images with the labels and predictions are shown in figure 4 (first row: normal, second row: malignant) and the accuracies of each method are summarized in table 1. The standard deviations for the average accuracies of the measurements were all within 10%. Also, Box plots comparing each method are shown in figure 5.
IV. DISCUSSION
Data Augmentation allowed the model to determine and learn the most relevant features from bigger data, and it actually increased the accuracy and specificity by 3% and 15%. However, the sensitivity dropped by 8% and the p-value of 0.19 indicates that the accuracies of original dataset and augmented data are not significantly different.
Adding more convolutional filters increased the accuracy, sensitivity, and specificity by 5%, 4%, and 7%, verifying that more filters extracted more features from the images. A p-value of 1.6E-05 is also consistent with the result that adding more convolutional filters significantly increased the testing accuracy.
Increasing image sizes raised the accuracy from 0.86 to 0.89 when compared at 30 epochs, verifying that it enabled the model to extract smaller and more detailed features. However, accuracies of different image sizes did not show much difference after they stabilized.
Therefore, 28 by 28 image sizes were used to compare the optimizers for a faster performance.
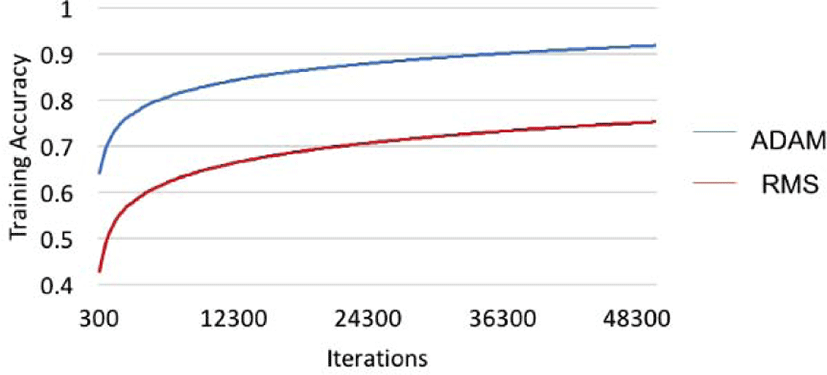
Changing the optimizer increased the accuracy by 3%, and the sensitivity by 6%, but decreased the specificity by 2%. The p-value of 0.006 also indicates that changing the optimizer from RMS to ADAM significantly increased the testing accuracy. Also, changing the optimizer resulted in a huge increase in the training accuracy (about 15%) as shown in Figure 6, and is expected to make a good training model for further use.
The main goal of this paper was to build the optimal model for breast mass classification by applying various methods that influence the performance of Convolutional Neural Network (CNN). The proposed model achieved the accuracy of 0.887, sensitivity of 0.903, and specificity of 0.869 for normal tissue versus malignant mass classification with augmented data, more convolutional filters, and ADAM optimizer.
Therefore, it is verified that breast mass classification using CNN has potential to be a better assisting tool than a CAD system in providing a consistent second opinion to a radiologist by reducing false-positive and false-negative diagnoses [10]. A limitation of this method, however, was that it only considered malignant masses that are relatively easy to classify than benign masses. Therefore, further studies are required in order to properly classify any given data for medical uses.