PDF Download
 PubReader
 Export Citation
 Email the Author
 Share Facebook
 Share Twitter
 Cited by 0 Article
 Metrics (View:30)







I. INTRODUCTION
Predicting how humans perceive image quality is a central goal of no-reference image quality assessment (NR-IQA), which estimates perceived quality without an undistorted reference [1]. Most NR-IQA progress has relied on benchmarks with artificially applied distortions such as blur, noise, or compression [2-3], assumptions that rarely hold for footage from deployed closed-circuit television (CCTV) systems, which is typically captured without post-hoc distortion yet still perceived as unclear or hard to interpret [4-5], since low illumination flattens contrast, sparse backgrounds suppress texture, and limited salient content reduces semantic interpretability.
In this paper, we model human perceptual quality for distortion-free CCTV imagery. Using CQA-DB, a CCTV IQA benchmark with subjective mean opinion scores (MOS) [6], we find that the entropy of local luminance and local texture account for much of the variation in human ratings. Motivated by this, we propose luminance and texture entropy based quality assessment (LTE-QA), a transformer-based NR-IQA model that takes spatial maps of these two entropy measures as direct input, achieving higher agreement with subjective ratings than representative baselines on real CCTV images. Perceived quality is also operationally consequential, since surveillance footage feeds downstream analytics such as abnormal behavior recognition [7] and personalized anomaly alarm systems [8], whose reliability degrades on frames that human operators already find hard to read.
Ⅱ. RELATED WORK
Early IQA benchmarks such as LIVE [1], TID2013 [2], and KADID-10k [3] apply synthetic distortions to clean references, while in-the-wild datasets such as KonIQ-10k [9] and SPAQ [10] capture authentic degradations in consumer photographs; these remain distinct from operational surveillance conditions. Recent transformer-based methods [11-12] further improve accuracy on such benchmarks by jointly modeling local distortion and semantic context, an idea also pursued through long-range interaction between local perceptual responses [13] and extended to video- and action-level quality prediction [14]. Beyond the images themselves, the subjective protocol used to label a benchmark also shapes what it measures; continuous and multimodal scoring has been shown to yield more stable subjective quality data than single-stimulus rating [15].
CCTV imagery presents distinct challenges for perceptual modeling. Unlike natural photographs, CCTV frames are captured under operational rather than photographic conditions, and their perceptual variability arises from environmental factors such as uneven illumination and sparse texture rather than explicit corruption [4], so distortion-centric IQA models do not capture them well even without synthetic distortion. Unlike prior transformer-based NR-IQA models [11-12] that learn distortion cues implicitly, LTE-QA explicitly encodes luminance and texture entropy as spatial maps fed directly into the transformer, targeting CCTV-specific degradations rather than the synthetic corruptions such models typically assume. Surveillance-specific quality benchmarks have only recently begun to appear, including CQA-DB for general CCTV scenes [6] and HIQA-DB for hospital surveillance [5], and both report that entropy-like statistics track subjective ratings more closely than distortion-oriented features do.
Ⅲ. DEFINING PERCEPTUAL CUES FOR LTE-QA
Given an image I, the luminance entropy is defined over the normalized histogram of its luminance component as
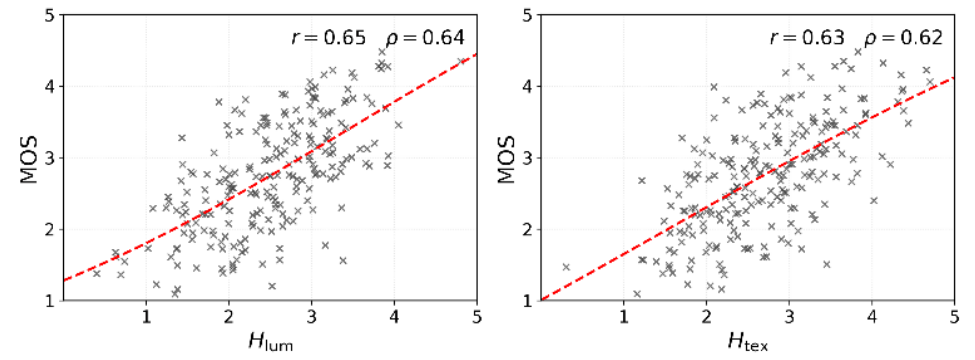
A higher value indicates a broader distribution of brightness levels, typically corresponding to better-lit, higher-contrast scenes, while underexposed or low-contrast frames common in night-time surveillance yield smaller values. We verify this relationship empirically on CQA-DB, obtaining a PLCC of 0.65 and an SRCC of 0.64 between luminance entropy and subjective MOS, as shown in Fig. 1 (left). The luminance histogram uses 256 bins over the standard 8-bit range, and coarser binning did not noticeably affect the resulting entropy values.
To characterize structural complexity, the texture entropy is computed from the responses of a steerable pyramid decomposition modeled by a generalized Gaussian distribution (GGD), and is defined as
Larger values reflect richer fine structures such as edges, foliage, or cluttered backgrounds, while flat or empty scenes yield lower values, texture entropy likewise correlates positively with subjective MOS, yielding a PLCC of 0.63 and an SRCC of 0.62, as shown in Fig. 1 (right). The pyramid decomposition uses three scales and four orientations, and the fitted GGD closely matches the empirical response histograms, supporting its use here. Entropy-based descriptors have proven perceptually informative in adjacent quality domains as well, including oculomotor demand in short-form video [16] and kinematic diversity in action quality assessment [14].
Ⅳ. LTE-QA MODEL
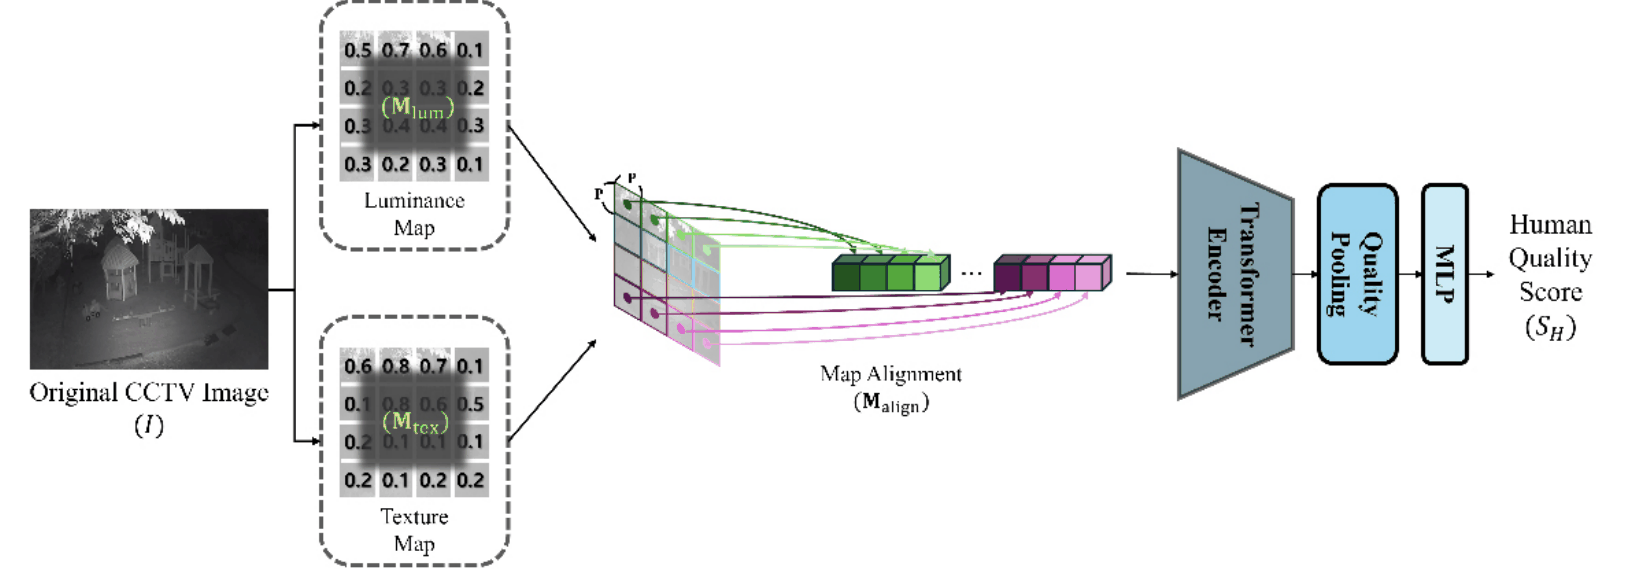
LTE-QA is a transformer-based NR-IQA model that takes luminance and texture entropy maps as direct input rather than raw pixel intensities, explicitly encoding the two perceptual cues that govern human ratings on CCTV imagery. The overall pipeline is illustrated in Fig. 2.
Given an input CCTV image I, we compute two spatially resolved entropy maps that encode brightness diversity and structural richness. The luminance map is obtained by evaluating over disjoint local patches of I, producing a per-patch measure of brightness diversity. The texture map is computed in the same manner using , capturing local structural richness. Both maps are normalized and resized to a common spatial resolution, and are then concatenated along the channel dimension to form the aligned representation as
which preserves the spatial correspondence between the two cues and serves as a unified input tensor for the subsequent transformer. Both maps are resized to 224×224 and combined via min–max normalization, which gave more stable training than z-score normalization.
The aligned tensor is divided into disjoint patches and linearly projected into a sequence of token embeddings. For the p-th patch, the embedding is computed as
where and are learnable parameters of the linear projection. Following the standard Vision Transformer (ViT) formulation, and consistent with prior evidence that long-range attention benefits perceptual quality regression [13], learnable position embeddings are added to the resulting tokens before they are passed through a transformer encoder. A quality pooling operation aggregates the encoded tokens into a single feature vector, which is then mapped to a scalar quality score by a multilayer perceptron (MLP) regressor. The model is trained end to end using the mean squared error (MSE) loss between the predicted score and the ground truth MOS as
We further add a ranking-aware pairwise loss alongside MSE, which improves accuracy as shown in Table 1. We also examine design choices, where element-wise addition and a convolutional-stem embedding underperform our design, and 8×8 patches trade accuracy for roughly four times the compute. Removing the position embedding lowers performance, and attention pooling outperforms the CLS token and mean pooling.
Ⅴ. EXPERIMENTS
We evaluate LTE-QA on the CQA-DB benchmark, which provides authentic CCTV images with subjective MOS labels. The model uses a ViT-Base (ViT-B/16) backbone in PyTorch, with entropy maps resized to 224×224 and partitioned into 16×16 patches. We train with the AdamW optimizer (learning rate , weight decay ) for 200 epochs, and report SRCC and PLCC to measure agreement between predicted scores and MOS. LTE-QA also generalizes beyond CCTV, outperforming the strongest baseline, MUSIQ, on KonIQ-10k, as shown in Table 2.
| Method | Backbone | CQA-DB | KonIQ-10k | ||||
|---|---|---|---|---|---|---|---|
| PLCC | SRCC | RMSE | PLCC | SRCC | |||
| BRISQUE [17] | - | 0.624 | 0.601 | 12.45 | 0.665 | 0.651 | |
| NIQE [18] | - | 0.512 | 0.498 | 15.12 | 0.542 | 0.531 | |
| DBCNN [19] | ResNet-50 | 0.814 | 0.802 | 8.32 | 0.854 | 0.841 | |
| HyperIQA [20] | ResNet-50 | 0.845 | 0.833 | 7.64 | 0.872 | 0.859 | |
| MUSIQ [21] | ResNet-50 | 0.871 | 0.860 | 6.88 | 0.891 | 0.880 | |
| LTE-QA (ours) | ViT-Tiny | 0.865 | 0.854 | 7.01 | 0.884 | 0.872 | |
| LTE-QA (ours) | ViT-Base | 0.912 | 0.901 | 5.12 | 0.924 | 0.915 | |
We compare LTE-QA with two classical natural scene statistics based methods, BRISQUE [17] and NIQE [18], and three learning-based methods, DBCNN [19], HyperIQA [20], and MUSIQ [21]. LTE-QA attains the best correlation among all methods, showing that entropy-guided representations align more closely with human ratings than handcrafted or generic learned features. A lightweight ViT-Tiny backbone remains competitive with our full ViT-Base model, and AdamW with a ranking-aware loss term improves accuracy and lowers the root mean squared error (RMSE) over SGD and MSE alone, as shown in Table 1.
We find that combining luminance and texture entropy consistently outperforms using either alone, as shown in Table 3, confirming that the two capture complementary aspects of perceived quality. Similarly, a linear regressor and single-scale entropy maps both underperform our full configuration, as shown in Table 1 and Table 3.
Texture entropy contributes more to performance than luminance entropy, likely because CCTV scenes vary more in structural clutter than in overall brightness.
| Condition | PLCC ↑ | SRCC ↑ |
|---|---|---|
| Indoor / day (ID) | 0.921 | 0.910 |
| Indoor / night (IN) | 0.894 | 0.881 |
| Outdoor / day (OD) | 0.915 | 0.902 |
| Outdoor / night (ON) | 0.891 | 0.879 |
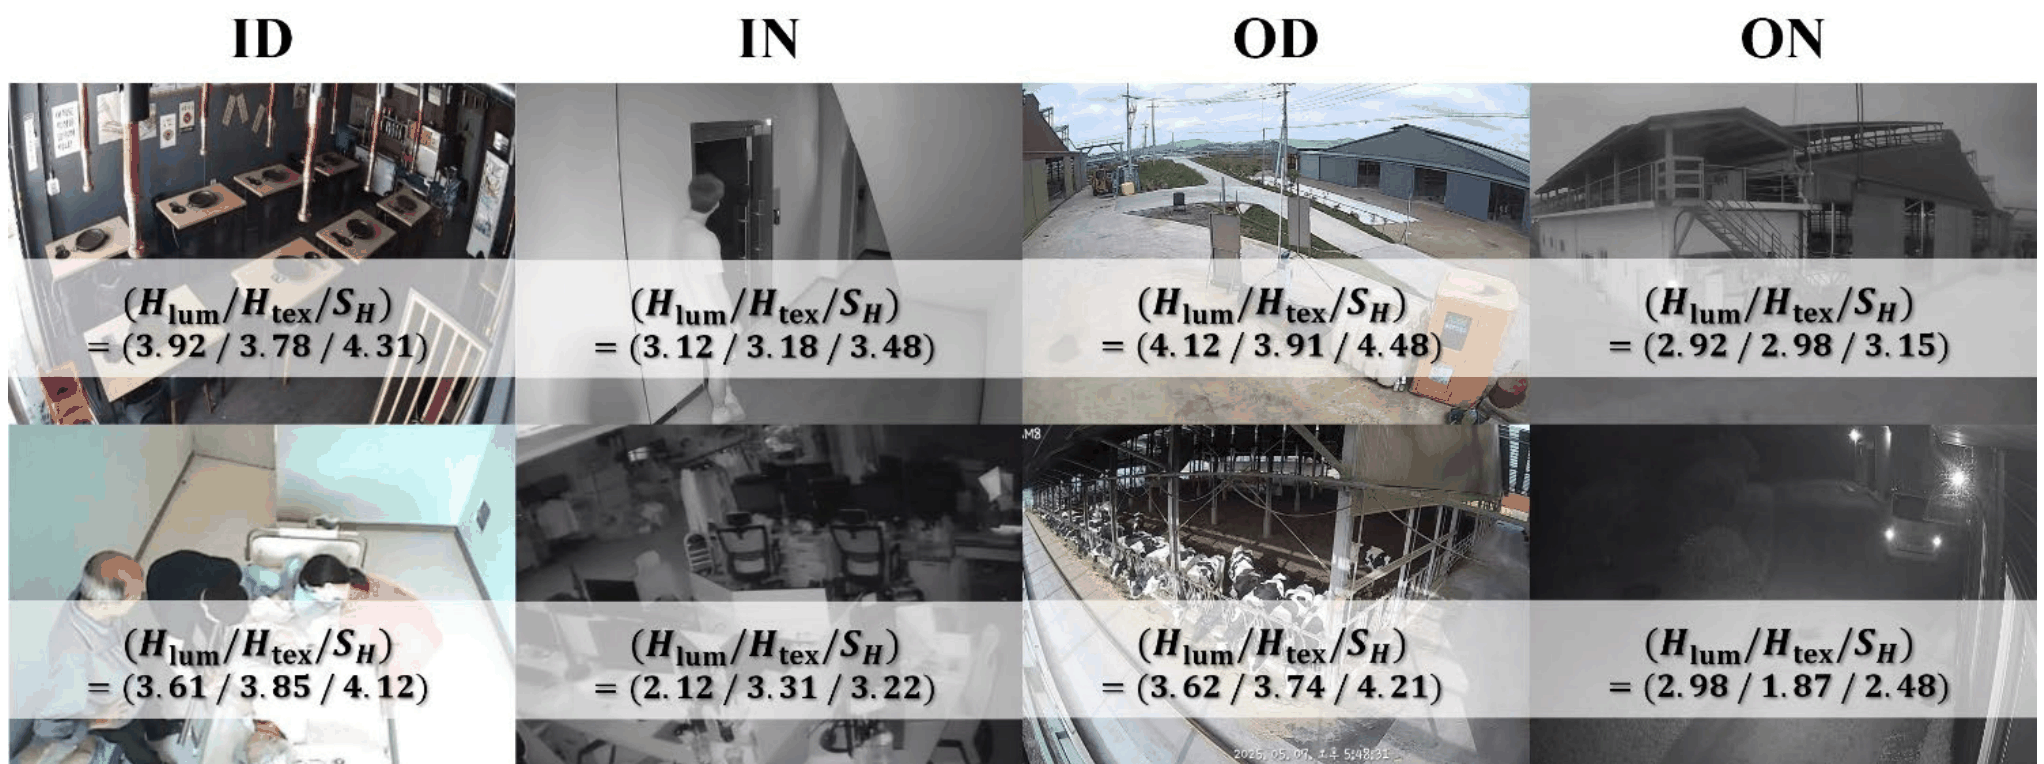
We inspect representative CCTV scenes to verify how LTE-QA responds to varying entropy patterns. Scenes with high and receive high predicted as shown in Fig. 3, while dark or texture-poor frames receive lower scores. Asymmetric cases, where one entropy is high and the other low, produce intermediate . Performance remains stable across conditions in Table 4. The modest drop under night conditions (IN/ON) likely reflects reduced luminance dynamic range, partially compensated by texture entropy.
Ⅵ. CONCLUSION
| Configuration | PLCC ↑ | SRCC ↑ |
|---|---|---|
| LTE-QA (Full, multi-scale) | 0.912 | 0.901 |
| w/o luminance entropy | 0.854 | 0.841 |
| w/o texture entropy | 0.832 | 0.820 |
| LTE-QA (single-scale) | 0.879 | 0.864 |
In this paper, we addressed human perceptual quality assessment for distortion-free CCTV imagery, showing on CQA-DB that luminance entropy and texture entropy are strongly correlated with subjective MOS. Building on this, we proposed LTE-QA, a transformer-based NR-IQA model that directly encodes these entropy maps as input, achieving higher agreement with human ratings than representative NR-IQA baselines. We note that the present framework is scoped to luminance and texture entropy as interpretable perceptual cues for authentic, distortion-free CCTV imagery, and does not yet incorporate other perceptual factors such as color fidelity or motion blur. Extending LTE-QA to additional perceptual cues, and to video-level settings where temporal entropy cues have proven informative [16,22], remains a direction for future work.