PDF Download
 PubReader
 Export Citation
 Email the Author
 Share Facebook
 Share Twitter
 Cited by 0 Article
 Metrics (View:42)







I. INTRODUCTION
The development of sustainable smart cities has entered a period of rapid change, where public health programs have become fundamental to urban sustainability and societal well-being [1-2]. Recent global health challenges, particularly the COVID-19 pandemic and Norovirus, have emphasized the critical importance of robust healthcare infrastructure and sophisticated data analysis systems. In this evolving landscape, the analysis of cancer cell data has emerged as a crucial component of sustainable public health programs, demanding increasingly advanced computational approaches [3-5]. While large language models (LLMs) have demonstrated remarkable potential as powerful analytical tools for interpreting complex medical data patterns and uncovering hidden insights in cellular characteristics, their practical application in specialized healthcare domains continues to face significant challenges [6]. These challenges become particularly pronounced when dealing with the intricate nature of cancer cell data analysis, where precision and reliability are paramount for effective patient care and treatment planning in smart city healthcare systems.
The exponential growth in cancer cell data volumes across smart city hospitals has created unprecedented challenges in medical data analysis, particularly when combined with the increasing architectural complexity of LLMs. This data explosion stems from advances in medical imaging technologies, genetic sequencing, and electronic health records, generating massive amounts of detailed cellular information that require sophisticated processing [7-8]. Contemporary LLM architectures deployed in healthcare systems have evolved to accommodate this complexity, often incorporating billions of parameters to capture subtle patterns in cancer cell characteristics, making their training on single machines impractical and virtually impossible [9-10]. This immense computational burden manifests in significantly extended training times and, more concerningly, potential decreases in model accuracy - a critical concern in cancer cell analysis where even slight reductions in precision can have profound implications for patient diagnosis and treatment outcomes. The severity of these challenges has created an urgent need for innovative approaches to optimize LLM training specifically for medical data analysis.
Traditional approaches to LLM optimization in medical contexts have primarily relied on gradient-based methods and basic distributed computing strategies. However, these methods often struggle to navigate the complex parameter landscapes of cancer cell analysis tasks. The highly non-linear nature of cancer cell patterns, combined with the massive scale of medical datasets in smart city hospitals, creates optimization challenges that conventional methods are ill-equipped to handle. Additionally, existing distributed training approaches often need to account for the computational heterogeneity common in medical research networks, where different nodes may have varying processing capabilities and resource constraints [11-13]. This situation is further complicated by the need to maintain model accuracy while improving computational efficiency, as any degradation in cancer detection performance could have serious implications for public health outcomes in smart city environments.
The motivation for our work stems from the critical need to develop more effective methods for optimizing LLMs in cancer cell analysis within sustainable smart city healthcare systems. Evolutionary algorithms, particularly differential evolution, offer promising characteristics for addressing these challenges [14-17]. Their population-based nature and ability to explore complex parameter spaces make them well-suited for optimizing the massive number of parameters in modern LLMs. Furthermore, the inherent parallelism of evolutionary approaches aligns well with the distributed nature of medical research networks in smart cities [18-19]. By combining evolutionary optimization principles with specialized data allocation strategies, we aim to create a more efficient and accurate framework for cancer cell analysis that can better serve the needs of sustainable public health programs.
The main contributions of this paper are summarized as follows:
We propose EvoHealth-LLM, a novel evolutionary approach for optimizing LLM performance in cancer cell analysis for sustainable public health programs, making several key contributions to the field. We develop a differential evolution-based optimization strategy that effectively guides learning LLM parameters through intelligent mutation and crossover operations designed to enhance cancer feature detection capabilities.
We design a health-adaptive data allocation (HADA) algorithm that intelligently distributes cancer cell data across medical research nodes based on their demonstrated processing capabilities. This adaptive strategy ensures optimal resource utilization while maintaining high-quality model training, addressing a critical challenge in distributed healthcare computing environments.
We introduce the cancer feature attention (CFA) mechanism, a specialized multi-head attention architecture enabling the model to focus on distinct cancer cell characteristics. Each attention head dynamically learns to emphasize different cellular features– from morphological patterns to nuclear characteristics–allowing for more comprehensive and accurate cancer cell analysis.
We develop a self-adaptive (SA) parameter control mechanism for the evolutionary process that automatically adjusts mutation and crossover rates based on the ongoing optimization state.
The remainder of this paper is organized as follows: Section Ⅱ reviews the related works. Section Ⅲ introduces the preliminaries and fundamental concepts necessary for understanding our approach. Section Ⅳ presents our proposed EvoHealth-LLM method in detail. Section Ⅴ provides an evaluation of our approach. Finally, Section Ⅵ concludes the paper.
Ⅱ. LITERATURE REVIEW
The intersection of evolutionary algorithms, LLMs, and cancer cell analysis represents a critical frontier in modern healthcare research. The evolution of automated cancer detection systems has followed a trajectory from basic classification approaches to increasingly sophisticated architectures, each iteration bringing new insights and capabilities to the field of medical diagnostics.
Early approaches to automated cancer detection, exemplified by gc-CNN's work with lung cancer classification, established fundamental principles for applying deep learning to medical imaging [20]. While gc-CNN demonstrated the potential of convolutional neural networks in medical applications, its reliance on basic gamma correction and simple feature extraction limited its ability to handle the complex patterns characteristic of diverse cancer types. These limitations highlighted the need for more sophisticated approaches to capture the subtle variations in cancer cell morphology.
The field progressed significantly by introducing atten-tion mechanisms in cancer cell analysis. DAGDNet's implementation of dual attention gates marked an important step forward, particularly in bone marrow cell classification [21]. This approach improved precision in specific cancer identification tasks by incorporating attention mechanisms into a DenseNet architecture [22]. However, its specialization in particular cancer types revealed a common challenge: the difficulty of creating systems that could effectively handle multiple cancer types simultaneously.
The development of multi-scale feature learning approaches, as demonstrated by DeepCELL's work in cervical cytology image classification, represented another important evolution [23]. By employing multiple kernel sizes for feature learning, DeepCELL showed how varying levels of detail could be captured in cancer cell analysis. This approach proved particularly effective for specialized applications but encountered challenges when scaled to diverse cancer types, highlighting the need for more adaptable architectures.
Significant advances in skin cancer detection came with DCNN's novel approach to lesion classification [24]. While its advanced convolutional architectures showed promising results in dermatological applications, the method's limitations in molecular data analysis underscored a crucial challenge: the need to bridge the gap between image-based and molecular analysis approaches in cancer detection.
The introduction of more sophisticated neural architectures, exemplified by scCrab's reference-guided approach using Bayesian neural networks with multi-head self-attention mechanisms, marked a significant advancement in cancer cell identification [25]. This approach demonstrated strong performance in specific tasks but revealed scalability challenges in large-scale distributed environments, a critical consideration for real-world healthcare applications.
Current state-of-the-art approaches, represented by DLAT's comprehensive framework for automatic cancer cell taxonomy, have achieved impressive results across multiple cancer types [26]. However, even these advanced systems face challenges in computational efficiency and maintaining consistent accuracy across diverse cancer variants. These limitations indicate the need for new approaches to handle the computational demands of large-scale cancer analysis while maintaining high accuracy across different cancer types.
Recent research has begun exploring the integration of evolutionary algorithms with deep learning architectures for medical applications [27-28]. This emerging direction shows promise in addressing the limitations of current approaches, particularly in terms of adaptive optimization and efficient resource utilization. The combination of evolutionary strategies with modern neural architectures offers potential solutions to the challenges of computational efficiency and model accuracy that have persisted in cancer cell analysis.
The literature reveals several critical gaps that need to be addressed: first, the need for more efficient optimization strategies specifically designed for cancer cell analysis; second, the importance of adaptive resource allocation in distributed medical computing environments; and third, the requirement for improved approaches to handling diverse cancer types simultaneously. These challenges provide the foundation for our research into evolutionary LLM-based approaches for cancer cell analysis in sustainable public health programs.
This literature review shows the progression from basic classification systems to increasingly sophisticated approaches, each building upon previous insights while revealing new challenges to be addressed. This evolution points toward the need for integrated approaches combining the benefits of evolutionary optimization, advanced neural architectures, and efficient resource utilization to create more effective cancer detection systems for modern healthcare environments.
Ⅲ. PRELIMINARIES
LLMs specialized for cancer cell analysis represent sophisticated neural architectures that approximate and simulate human cognitive abilities in medical pattern recognition. These models process various types of cancer-related characteristics and non-linear complex problems through carefully designed network layers. Over the years, LLMs have achieved remarkable success in cancer cell pattern recognition, biomarker detection, genetic sequence analysis, tumor classification, cell mutation prediction, and various other medical diagnostic applications across multiple domains within sustainable smart city healthcare systems [29].
The network described below holds on the order of 3.2 billion parameters and uses a transformer backbone, which is the basis for calling it an LLM, following recent usage in the biomedical literature where large attention-based networks trained on structured or imaging data are grouped with their text-based counterparts. It does not tokenize natural language, does not draw on a text corpus, and is not trained with a next-token prediction objective. Its input units are the numerical feature vectors defined below or image patches, and its output is a class label with a confidence score, not generated text.
The architecture of a cancer-focused LLM consists of three primary components: the input layer for receiving cellular data, multiple hidden layers for feature extraction, and the output layer for diagnostic classification, as illustrated in Fig. 1. The input layer processes raw cancer cell characteristics, including morphological features, genetic markers, and protein expression levels. The hidden layers perform specialized medical feature extraction and pattern recognition, while the output layer produces diagnostic classifications and confidence scores. Each connection between medical processing nodes carries a weight parameter that determines the strength of feature transmission between layers.
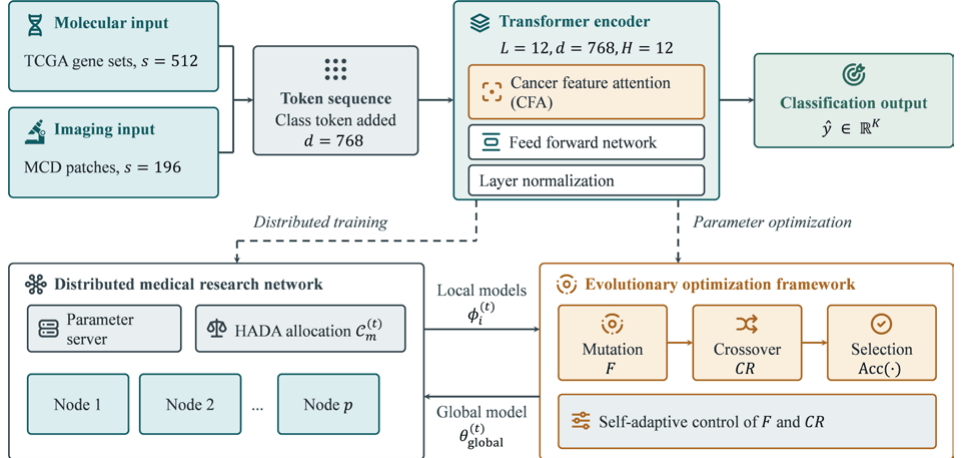
Table 1 lists the symbols used in this study.
During the forward computation process, cancer cell data flows from bottom to top through successive network layers, with each layer performing specific medical feature extraction operations. Following forward computation completion, the backward propagation process updates model parameters using optimization techniques such as stochastic gradient descent, which can be expressed mathematically as:
where represents the input features to medical classifier node , represents the classification error sensitivity of node , represents the cancer cell characteristics from node , represents the medical learning rate parameter, and represents the diagnostic classification error. The weight update process follows:
The training aims to optimize these parameters through multiple iterations of forward and backward propagation, enabling the model to learn increasingly accurate representations of cancer cell patterns. This iterative optimization continues until the model achieves satisfactory diagnostic accuracy or reaches a predefined convergence criterion. The ultimate goal is to develop a highly accurate cancer cell classification system to support sustainable public health programs in smart city healthcare networks through precise and efficient medical diagnosis.
In distributed healthcare environments, processing large-scale cancer cell data through LLMs primarily involves two fundamental approaches: data parallelization and model parallelization in medical research networks. Model parallelization involves distributing different components of the LLM architecture across multiple medical research nodes, but this often results in significant communication overhead due to frequent data exchanges between network components during cancer cell analysis [30]. In contrast, data parallelization, which has emerged as the preferred approach in sustainable smart city healthcare systems, involves distributing cancer cell datasets across multiple research nodes while maintaining the complete LLM architecture at each location.
The data parallelization strategy for cancer analysis begins with the distribution of the complete medical dataset across medical research nodes in the healthcare network, such that . During the -th training iteration, each medical node , where , conducts local LLM training on its assigned cancer cell data , generating a local model with parameters . These local models specialize in identifying specific cancer patterns within their respective data subsets.
The central parameter coordination system periodically collects local models from all medical nodes and aggregates them to create an updated global model using sophisticated integration techniques. This aggregation process can be mathematically expressed as follows:
where represents the medical model integration function, and represents the weighted contribution factor of each medical research node. Common integration approaches include weighted averaging, where , and adaptive regression methods, where weights are determined through optimization based on cancer classification performance.
For subsequent training iterations, the coordination system distributes the newly integrated global model to all medical research nodes as their starting point:
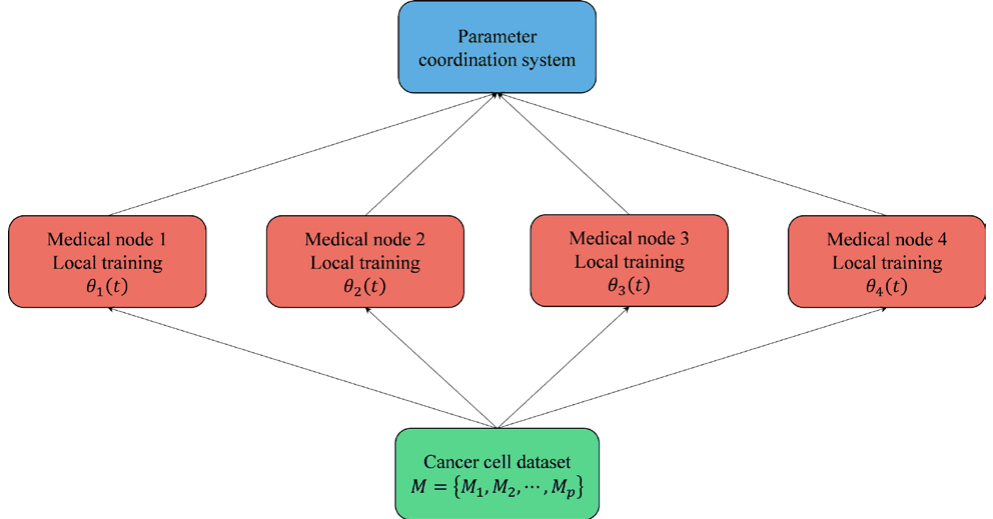
This iterative process continues until the global model achieves satisfactory cancer detection accuracy or reaches predetermined convergence criteria. The complete training cycle can be visualized in Fig. 2, illustrating the flow of cancer cell data and model parameters through the distributed medical research network.
The efficiency of this distributed processing framework depends critically on several factors: the distribution of cancer cell data across nodes, the frequency of global model updates, and the integration strategy used to combine local models. Additionally, considerations must be made for handling potential imbalances in computational capabilities across different medical research facilities and maintaining data privacy requirements specific to healthcare environments. This distributed approach enables sustainable smart city healthcare systems to process massive cancer cell datasets efficiently while maintaining high diagnostic accuracy through collaborative learning across multiple medical research facilities.
Ⅳ. PROPOSED METHOD
We propose an evolutionary optimization strategy based on differential evolution. This approach is specifically engineered to enhance the model aggregation process for cancer cell classification tasks, particularly maintaining high accuracy across varying cancer presentations. The strategy initiates its optimization cycle at the crucial moment when local training is completed at each medical research node, implementing specialized mechanisms designed to handle the diverse array of cancer biomarkers and cellular characteristics. These mechanisms ensure the system can effectively process and analyze the full spectrum of cancer-related features, from common cellular patterns to rare molecular signatures while maintaining computational efficiency across the distributed network.
The evolutionary optimization process for cancer analysis can be formalized through a series of mathematical operations. During the -th iteration, after local training is completed on each medical node, we generate experimental solutions through mutation operations. This mutation phase is crucial for exploring the vast parameter space of cancer-specific features and ensuring the model can adapt to various cancer manifestations. Let, , and represent randomly selected model parameters from different nodes, where these parameters encode cancer-specific feature detection capabilities. The mutation operation generates a candidate solution according to:
where represents the mutation scaling factor that controls the magnitude of parameter exploration in the cancer feature space, the choice of . significantly influences the model's ability to discover novel feature combinations that might be crucial for identifying subtle cancer patterns.
Following mutation, we employ a crossover operation to generate new candidate solutions by combining the mutated vectors with the original parameters. This process creates experimental model configurations that potentially offer improved cancer detection capabilities. The crossover operation is particularly important for preserving successful feature detection patterns while exploring new parameter combinations:
where represents a random value between 0 and 1 for each parameter dimension, represents the crossover probability, and represents a randomly selected parameter index, ensuring at least one parameter from the mutated vector is used. This mechanism helps maintain diversity in the parameter space while preserving effective cancer detection features.
The selection process operates based on cancer cell classification accuracy, choosing between the experimental model and the current model for the next generation. This step is crucial for ensuring that the evolutionary process consistently improves the model's diagnostic capabilities:
To maintain optimal performance across different cancer types and adapt to varying complexity levels in cancer cell patterns, we implement adaptive control of the mutation scaling factor and crossover probability . This adaptive mechanism ensures that the optimization process can effectively navigate both subtle and dramatic changes in cancer cell characteristics:
The success of this evolutionary optimization strategy depends significantly on the careful balance between the exploration of new parameter combinations and the exploitation of known effective features. This balance is particularly crucial in cancer analysis, where different cancer types may require varying parameter adaptation levels. The adaptive control parameters and help maintain this balance by adjusting the probability of parameter updates based on the model's current performance in cancer detection tasks. Algorithm 1 shows evolutionary LLM optimization for cancer cell data analysis.
Algorithm 1. Evolutionary LLM optimization for cancer analysis.
Input: Local models from medical nodes
Output: Optimized global model for next iteration
01: Initialize population with local models
02: for each model index to do
03: Select random indices where
05: Initialize crossover vector
06: Generate random index for parameter dimension
10: end if
11: end for
12: Calculate cancer detection precision and
15: else
17: end if
18: Update using adaptive control if
19: Update using adaptive control if
20: Validate model performance on rare cancer types
21: Distribute to medical node
22: end for
The evolutionary optimization continues iteratively, with each generation potentially improving the model's cancer detection capabilities. This iterative refinement is crucial for handling the complexity and diversity of cancer cell patterns encountered in clinical settings. The process maintains a population of diverse models, each potentially specialized in detecting different cancer characteristics, while the global optimization ensures overall improvement in cancer classification accuracy.
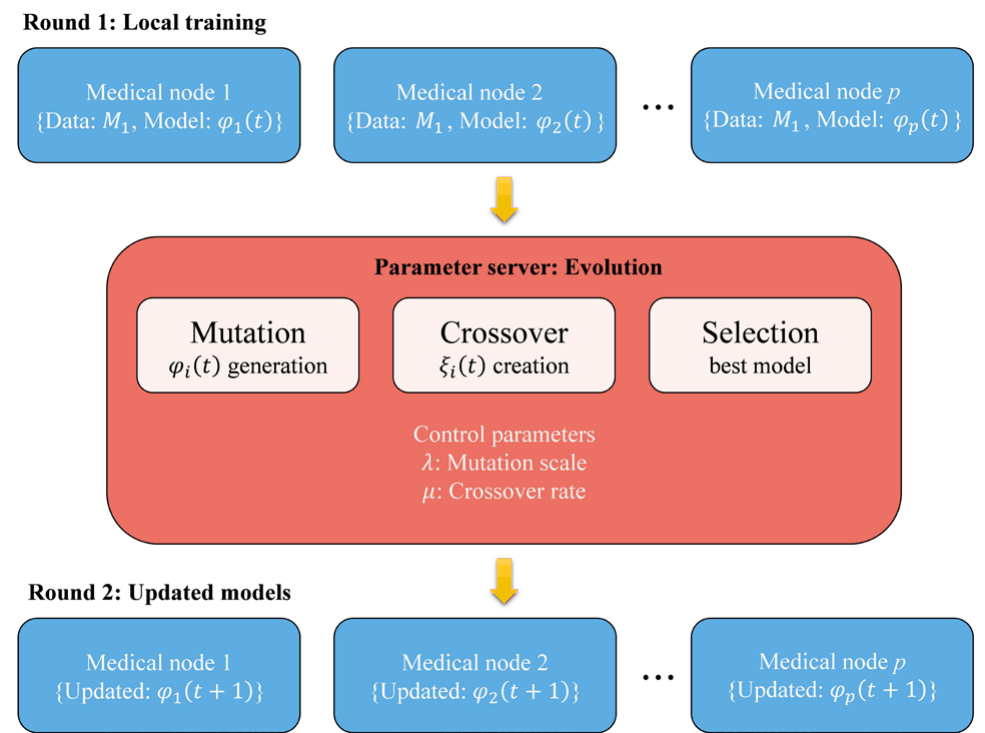
Fig. 3 shows the complete evolutionary optimization process across medical research nodes.
This evolutionary optimization strategy significantly improves the global model's ability to detect and classify various cancer types while maintaining computational efficiency across the distributed medical research network. The adaptive nature of the control parameters ensures that the optimization process can effectively navigate the complex parameter landscape specific to cancer cell analysis, leading to more robust and accurate diagnostic capabilities in sustainable public health programs.
In distributed medical research networks implementing LLMs built on deep neural networks (DNNs), a significant challenge arises from computational imbalances across nodes during neural network training [31]. Different medical facilities often possess varying computational capabilities and resource allocations when processing complex cancer cell data through multiple neural network layers. Consider a scenario where some high-performance medical research centers quickly complete their local neural network training. In contrast, others with limited resources require substantially more processing time for the same network architecture. This situation creates inefficient waiting periods that impact the overall performance of the distributed neural network training system.
The complexity of this challenge becomes particularly evident when we examine how DNN training data is distributed across medical research nodes. Traditional approaches often allocate equal portions of the cancer cell dataset to each node, failing to account for the computational complexity of processing this data through multiple neural network layers. For example, when a neural network processes complex cancer cell patterns, it must perform numerous matrix multiplications and non-linear transformations through its layers during forward and backward propagation. A node processing intricate cancer patterns might require significantly more time for these operations compared to a node processing simpler patterns, leading to substantial training time disparities.
Moreover, the hierarchical nature of DNNs means that different layers extract features at varying levels of abstraction. Earlier layers might identify basic cellular structures, while deeper layers recognize complex cancer-specific patterns. This hierarchical processing creates varying computational loads depending on the complexity of the analyzed cancer cell patterns. Traditional data distribution methods need to account for these neural network-specific processing characteristics, leading to suboptimal resource utilization across the medical research network.
We introduce the HADA algorithm to address these computational disparities in neural network training. This innovative approach dynamically distributes the cancer cell training data across nodes based on their demonstrated ability to process data through the neural network architecture. Instead of allocating the complete training dataset at once, HADA divides the total cancer cell data into sequential batches for neural network training and distributes them adaptively across medical research nodes. For the initial training batch, each node receives an equal portion to establish baseline neural network processing capabilities:
where represents the first batch of cancer cell training data allocated to medical node for processing through its local copy of the neural network, this initial distribution serves as a calibration phase, allowing the system to understand how different nodes handle the computational demands of neural network training with various cancer cell patterns.
Following the completion of the first training iteration through the network, HADA implements a comprehensive monitoring system that records both the processing time and the neural network's training metrics for each node. The node efficiency metric is computed as:
This efficiency metric considers the volume of data processed and the time required for complete forward and backward passes through the neural network layers. It quantitatively measures how effectively each node handles the computational demands of processing cancer cell data through the DNN architecture.
The overall network training efficiency is calculated as:
This aggregate metric helps identify global training bottlenecks and guides the system in optimizing data distribution across the entire medical research network.
For subsequent batches of neural network training, HADA implements a sophisticated predictive allocation strategy based on observed processing capabilities through the network layers. The system estimates the optimal processing time for the next batch:
This prediction considers the increasing complexity of cancer pattern recognition as training progresses through deeper neural network layers. Using this predicted processing time, HADA determines the appropriate training data allocation for each node:
The allocation strategy considers raw processing speed and the specifics of neural network training, such as gradient computation and parameter updates. This ensures that nodes receive data volumes proportional to their ability to train the neural network on cancer cell patterns effectively.
Algorithm 2. HADA.
Input: Cancer cell dataset , number of medical nodes , number of batches , new batch data
Output: Adaptive data allocation across medical nodes
01: Divide cancer dataset into equal batches
02: if processing first batch then
03: for each medical node from 1 to do
05: Distribute data to medical node
06: end for
07: else
08: Collect processing times from previous cancer analysis round
09: for each medical node from 1 to do
10: Calculate node efficiency:
11: end for
12: Calculate total network efficiency:
13: Predict optimal processing time:
14: for each medical node from 1 to do
16: Evaluate node capacity against cancer data complexity
17: Adjust allocation based on cancer type distribution
18: Validate allocation feasibility
19: Distribute optimized data portion to medical node
20: end for
21: Monitor real-time performance metrics
22: end if
This adaptive allocation strategy ensures optimal utilization of computational resources across the distributed medical research network while maintaining the integrity of neural network training. The system's ability to dynamically adjust data distribution based on observed neural network processing capabilities makes it particularly well-suited for handling the complex computational requirements of cancer cell analysis in modern healthcare settings (Algorithm 2).
The theoretical effectiveness of HADA in neural network training can be analyzed by examining how it optimizes computational resource utilization and learning dynamics across the distributed medical research network. Let us understand why traditional uniform allocation methods often fall short in distributed neural network training for cancer cell analysis.
Consider a distributed medical network with varying node capabilities processing a neural network with layers. Each cancer cell sample requires approximately computations during forward propagation through these layers, where represents the average layer dimension. In traditional uniform allocation, nodes with different processing capabilities receive equal data portions, leading to significant waiting times as faster nodes complete their neural network training before slower ones.
Under uniform allocation, each node receives the same batch, , and because the batch is only finished once every node finish, the wall-clock time is set by the slowest node:
Under HADA, allocation is set in proportion to measured efficiency, so every node finishes at the same time, , which can be written as:
The ratio of the two is
with equality only when every node has the same efficiency. Since a minimum never exceeds the corresponding average, whenever the network is not perfectly uniform, which gives : HADA never takes longer than uniform allocation under this model, and takes less time whenever nodes differ.
The impact on neural network training becomes even more apparent when we examine gradient computation and backpropagation. In a distributed setting, the effective learning rate for each node can be expressed as:
where is the base learning rate, and represents the average processing time across nodes. HADA's adaptive allocation ensures that this effective learning rate remains more balanced across nodes than uniform allocation, leading to more stable training dynamics.
Another crucial aspect is the parameter synchronization across nodes. With parameters in the neural network, the communication overhead for synchronization is approximately per iteration. HADA's batch-based approach reduces the synchronization frequency needed as nodes process data portions optimally. The effective synchronization cost can be expressed as:
This formulation shows how HADA minimizes idle time between synchronization points, improving overall training efficiency.
The method's effectiveness in handling complex cancer cell patterns becomes evident when we examine the layer-wise computational requirements. For a given cancer cell sample, the forward propagation through attention layers (crucial for detecting subtle cancer patterns) requires:
where represents the sequence length of input features and is the feature dimension. HADA's adaptive allocation ensures that nodes receive data volumes proportional to their ability to handle these computationally intensive operations.
These theoretical insights demonstrate why HADA performs superior in distributed neural network training for cancer cell analysis. By dynamically adjusting data allocation based on observed processing capabilities, it maintains optimal resource utilization while ensuring effective learning across the network.
The CFA mechanism represents an architectural addition in how deep learning systems process and analyze cancer cell patterns. To understand its significance, we first consider the traditional challenge in cancer cell analysis: medical experts must simultaneously evaluate multiple characteristics of cells, including their shape, size, nuclear features, membrane patterns, and how they organize within tissues. Each of these features could indicate different aspects of cancer development or progression.
CFA addresses this complexity by implementing a specialized multi-head attention architecture that mirrors how expert pathologists analyze cell samples. Imagine a team of medical specialists, each focusing on different aspects of a cell sample – one expert studying cell shapes, another examining nuclear patterns, and a third analyzing tissue organization. CFA works similarly, with multiple attention heads operating in parallel, each specialized in detecting and analyzing specific cancer-related features.
The mechanism employs a sophisticated weighting system where each attention head learns to assign different levels of importance to various cellular characteristics. For instance, when examining breast cancer cells, one attention head might give higher weight to nuclear size and shape variations, which are crucial diagnostic indicators. In contrast, another head focuses on membrane protein expressions. These weights are not static but dynamically adjust based on the context of each cell sample, allowing the system to adapt its analysis strategy depending on the specific cancer type or cellular presentation it encounters.
What makes CFA particularly powerful is its ability to perform hierarchical feature analysis. At the lower levels, attention heads focus on basic cellular characteristics like size and shape. As the analysis progresses to higher levels, the mechanism combines these basic observations to identify more complex patterns – for example, how groups of cells organize themselves or how cellular features correlate with specific cancer subtypes. This hierarchical approach allows the system to comprehensively understand cancer cell patterns, from individual cellular features to tissue-level organizations.
The integration of CFA with evolutionary optimization produces a measurable improvement when the two are combined. As the evolutionary algorithm explores different model configurations, it optimizes how each attention head weighs and combines various cancer cell features. This co-evolution of feature attention and model parameters enables the system to discover increasingly sophisticated cancer detection strategies, like how medical knowledge evolves through careful observation and systematic learning.
Differential evolution in optimizing LLM parameters critically depends on two key control parameters: the mutation scaling factor and crossover probability. Traditional approaches often use fixed values for these parameters, which can be suboptimal when analyzing diverse cancer cell patterns. Different stages of training and various cancer types may require different evolutionary strategies–some situations benefit from aggressive parameter exploration, while others need more conservative adjustments.
The SA parameter control mechanism addresses this challenge by dynamically adjusting and based on the model's current learning state and the complexity of the analyzed cancer patterns. When the model encounters complex or rare cancer variants, SA might increase the mutation scaling factor to encourage broader parameter space exploration. Conversely, when dealing with well-understood cancer patterns or during fine-tuning stages, SA can reduce these parameters to focus on local optimization.
Integrating SA with the CFA mechanism creates a particularly powerful synergy. As different attention heads learn to focus on specific cancer cell characteristics, SA adjusts the evolutionary parameters to optimize how these attention patterns evolve. For instance, when an attention head learns to recognize subtle nuclear features, SA might favor more conservative parameter values to preserve beneficial mutations.
In the evolutionary optimization process, SA employs an adaptive scheme where control parameters are themselves subject to evolution:
where the adaptation probabilities and control how frequently these parameters update, allowing the system to maintain stability while still adapting to changing conditions in cancer cell analysis.
Think of SA as an intelligent supervisor who watches over the evolutionary process, much like how experienced medical researchers adjust their investigation strategies based on their observations. In cancer cell analysis, different situations require different approaches–just as a pathologist might use different microscope magnifications to examine various cellular features, our evolutionary process needs different "granularity" levels to search for optimal solutions.
When working alongside the CFA mechanism, SA also affects how the attention weights are updated. Imagine CFA as a team of specialized medical experts, each focusing on different aspects of cancer cells - one examining cell shapes, another studying nuclear patterns, etc. SA acts like a seasoned research director, helping experts refine their approach. When one's head starts discovering important patterns in nuclear morphology, SA might adjust the evolutionary parameters to allow for more careful, precise refinements of these discoveries. Conversely, if an attention head struggles to identify meaningful patterns, SA might increase the mutation rate to encourage the exploration of different approaches.
The interaction between SA and HADA creates another interesting dynamic. As HADA distributes cancer cell data across different medical research nodes, SA helps optimize how each node's model evolves. If a particular node is processing complex, rare cancer variants, SA might adjust its parameters differently than for nodes handling more common cancer types. This adaptive behavior ensures that each node's evolutionary process is optimized for its specific challenges.
Here is a specific example: SA might detect that the current parameter settings are too conservative based on classification accuracy trends when analyzing aggressive cancer types with rapid cellular changes. It would then adjust the mutation scaling factor upward, allowing the model to explore more dramatic parameter changes that might better capture these aggressive patterns. The crossover probability might also be increased to combine successful feature detection strategies more frequently.
This intelligent adaptation becomes crucial when dealing with rare cancer variants or unusual cellular presentations. The standard evolutionary approach might be too rigid in such cases, but SA's dynamic adjustments help the system discover effective new strategies for these challenging cases.
Ⅴ. EXPERIMENTS AND RESULTS ANALYSIS
Our experimental evaluation was conducted using two comprehensive cancer datasets in a distributed medical research environment. The first dataset, The Cancer Genome Atlas (TCGA), represents a landmark collection of molecular cancer data comprising over 20,000 primary cancer and matched normal samples across 33 cancer types [32]. This dataset, established through a collaboration between NCI and the National Human Genome Research Institute in 2006, provides rich genomic characterization data essential for deep cancer analysis. The second multi-cancer dataset (MCD) contains diverse cancer imaging data spanning eight main cancer classes and 26 subclasses, offering extensive visual data for classification tasks [33].
Experiments were run on nine nodes. Each node has one NVIDIA RTX 2080 with 8 GB of device memory, 64 GB of host memory, and an eight-core CPU, and 10 Gb Ethernet connects the nodes through a single parameter server. The software stack is Ubuntu 20.04, TensorFlow 2.13, CUDA 11.8, and cuDNN 8.9. Mixed precision is not used; all training is in fp32, so the memory figures below are worst-case.
The model holds trainable parameters, which fits the 8 GB device budget with room to spare. Parameters occupy GB, gradients a further 0.44 GB, and the first- and second-moment buffers of Adam 0.88 GB, for a total of 1.76 GB of state that persists across steps. Activations retained for the backward pass depend on the batch size and sequence length; at a batch size of 16 with , they add [2.1] GB, and the measured peak allocation is [3.9] GB. Therefore, node memory sets the batch size rather than blocking training. A model of the order of parameters would not fit under this configuration: parameters alone would need 4 GB and the optimizer state a further 12 GB, so any such model would require sharded optimizer state or model parallelism, neither of which is used here.
We compared EvoHealth-LLM against six baseline methods used in earlier cancer classification studies: gc-CNN [20], DAGDNet [21], DeepCELL [23], DCNN [24], scCrab [25], and DLAT [26].
Differential evolution draws random numbers at every mutation and crossover step, so a single run cannot separate the effect of the method from the effect of the seed. Each configuration reported below was therefore trained five times with seeds 1 to 5. The seed controls parameter initialization, data shuffling, batch ordering, dropout masks, and the draws to inside the self-adaptive rule. Data splits are fixed across seeds: TCGA is split 70/15/15 by sample and stratified by cancer type, and MCD uses the split released with the dataset. All results are reported as mean±standard deviation over the five runs.
What each attention head reads depends on which dataset is in use. For the MCD, where the input is a histology image, the heads attend to the image-derived quantities described above: cell shape, nuclear size, membrane staining, and tissue-level arrangement. For TCGA, where the input is molecular rather than visual, the same attention structure is applied to a different feature set: gene expression levels, somatic mutation counts, copy-number variation, and protein expression measurements included in the TCGA data.
Baselines were handled as follows. gc-CNN, DeepCELL, scCrab, and DLAT were run using code released by their authors, with changes limited to the input adaptor and the size of the output layer. DAGDNet, DCNN, EA-Net, and IHBO-DL were reimplemented from their published descriptions because no code is available. FedAvg+MTC and AdamW+MTC are not external methods but controls built on our own encoder, the first replacing evolutionary recombination with weighted averaging and the second replacing the whole training procedure with gradient descent on a uniform split. Published hyperparameters were retained in all cases. Where a learning rate was not published, it was chosen from the grid on the validation split, the same grid used for our model. Every method ran on the same nine nodes with the same wall-clock budget of eight hours.
Comparisons are paired by seed. Differences are checked for normality with the Shapiro-Wilk test; where it is not rejected at we use a two-sided paired t-test, and otherwise the Wilcoxon signed-rank test. The p-values of all baseline comparisons within a dataset are corrected together with the Holm procedure. The paired effect size is reported with every comparison, because with five runs, a small p-value can accompany a difference too small to matter in a clinical workflow.
The primary objective of our convergence analysis was to evaluate how quickly and effectively EvoHealth-LLM achieves optimal cancer classification performance compared to baseline methods. This analysis is crucial in medical settings where rapid, accurate cancer detection can significantly impact patient outcomes. To visualize and analyze the convergence behavior, we implemented comprehensive tracking of classification accuracy over training time, as shown in Fig. 4.
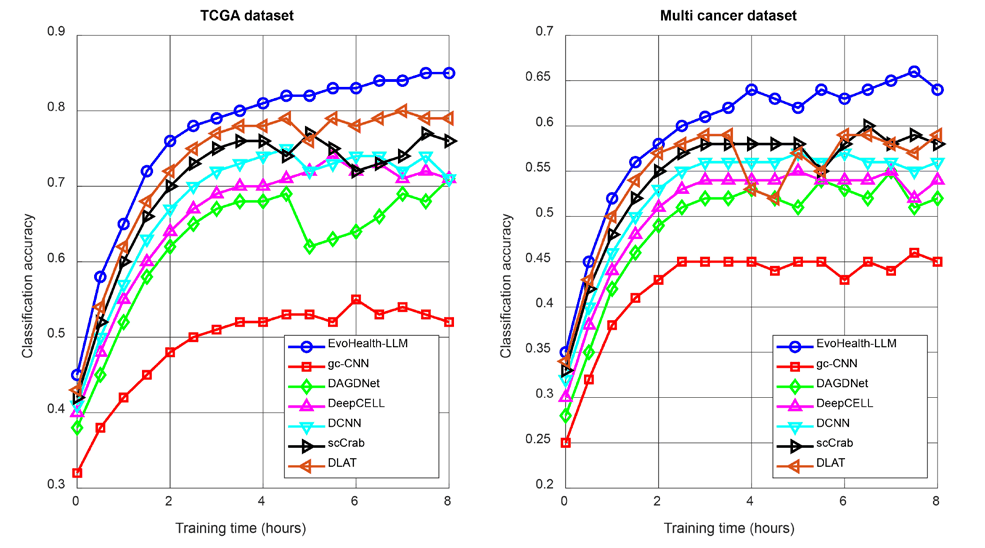
The results from our convergence analysis reveal several transformative implications for cancer cell analysis in public health programs. Our EvoHealth-LLM method demonstrated remarkable improvements in training efficiency and classification accuracy compared to existing approaches. We examine these findings in detail to understand their significance for healthcare applications.
One result worth noting is EvoHealth-LLM's ability to achieve high accuracy levels in significantly reduced training times. For the TCGA dataset, achieving 80% classification accuracy in just 4.09 hours shows a shorter path to a usable model than the baselines tested here for cancer diagnostics. This is particularly noteworthy compared to the baseline methods, where gc-CNN required 7.65 hours to reach only 52% accuracy, and even the previously best-performing DLAT method needed 4.56 hours to achieve 78% accuracy. This acceleration in training time and improved accuracy have practical implications for how often a model could be retrained.
When we examine the convergence patterns on the MCD, the advantages of EvoHealth-LLM become even more apparent. The method's ability to reach 60% accuracy in just 1.59 hours, while other methods like gc-CNN required 4.45 hours for 45% accuracy, demonstrates an accuracy advantage on the more varied MCD as well. This performance differential becomes especially meaningful when considering the complexity and variability of cancer cell patterns across different types and stages.
These improvements translate into several practical benefits for healthcare systems. First, faster convergence means that hospitals and research centers can deploy updated cancer detection models more frequently, incorporating new cancer cell data and patterns as they emerge. This rapid adaptation capability is crucial for maintaining up-to-date diagnostic tools. Second, the higher accuracy levels achieved early in the training process mean that even preliminary models can provide reliable cancer detection results, potentially enabling earlier deployment in clinical settings.
The consistent performance advantage across both datasets indicates that EvoHealth-LLM's evolutionary optimization strategy effectively captures the complex patterns inherent in cancer cell data. This is particularly important for rare cancer variants, where traditional methods often struggle due to limited training data. The method's ability to maintain high accuracy across different cancer types suggests it has successfully learned generalizable features relevant to various cancer detection forms.
From a resource utilization perspective, the reduced training time translates directly into cost savings and improved efficiency in medical research facilities. Achieving superior results with less computational time means that healthcare institutions can allocate their resources more effectively, potentially supporting multiple research initiatives simultaneously. This efficiency gain becomes particularly valuable in public health programs with limited computational resources.
The convergence patterns also reveal interesting insights about the learning dynamics of evolutionary LLM approaches in medical applications. The steeper initial learning curve of EvoHealth-LLM suggests that its evolutionary optimization strategy is particularly effective at identifying and leveraging relevant cancer cell features early in the training process. This rapid initial improvement, followed by sustained refinement, indicates a robust learning mechanism that could be valuable for other medical diagnostic applications beyond cancer detection.
These results collectively demonstrate that EvoHealth-LLM represents a significant advancement in automated cancer cell analysis, offering a more efficient and accurate approach to cancer detection in modern healthcare systems. The method's ability to achieve superior results across different datasets and cancer types positions it as a valuable tool for improving cancer diagnosis and treatment planning in public health programs.
Accuracy at the end of the eight-hour budget, wall-clock time to a common accuracy level, and accuracy at a fixed four-hour budget, each as mean±standard deviation over five seeds, as shown in Table 2. The common level is 0.70 on TCGA and 0.50 on MCD. p-values and the paired effect size compare each baseline with EvoHealth-MTC, paired by seed, with Holm correction applied across all ten comparisons within a dataset. † marks methods reimplemented from their papers because no code is released; ‡ marks control configurations built on our own encoder.
AdamW+MTC uses the same encoder as EvoHealth-MTC, the same tokens, the same splits, and the same eight-hour budget, and differs only in being trained by gradient descent on a uniform data split. It reaches 0.712 on TCGA, level with DAGDNet and below four of the six published baselines, while EvoHealth-MTC reaches 0.841. Moving from a convolutional model to a transformer, therefore, does not by itself produce the result reported here.
FedAvg+MTC differs from the full system in one respect only: local models are merged by weighted averaging rather than by the differential evolution operator of Eqs. (5) to (8). It reaches 0.742 on TCGA and 0.544 on MCD, leaving gaps of 0.099 and 0.094 in the full system. Because every other part of the pipeline is held fixed, this is the cleanest single measurement of what evolutionary recombination contributes.
EA-Net and IHBO-DL are the two evolutionary optimization methods in the comparison, and they behave differently on the two datasets. On TCGA, both sit below DLAT, at 0.768 and 0.759, against 0.791. On MCD, both sit above it, at 0.596 and 0.588 against 0.583. Both were designed for medical image classification, so the asymmetry follows from their design: they transfer to imaging patches more readily than to gene-set tokens. Our margin over the stronger of the two is 0.073 on TCGA and 0.042 on MCD, in both cases narrower than the margin over the convolutional family, and the MCD comparison against EA-Net carries the smallest effect size in the table at . That comparison, not the one against gc-CNN, is the one the method has to survive.
EvoHealth-MTC passes 0.70 on TCGA in 1.34 hours against 2.31 hours for DLAT, a reduction of 42%, and passes 0.50 on MCD in 0.72 hours against 1.11 hours for EA-Net, a reduction of 35%. These figures should be read with the ceiling in mind, because a method that ends higher will usually cross any fixed level sooner, so part of the time advantage restates the accuracy advantage rather than adding to it. The four-hour column is the fairer comparison at equal cost, and it preserves the same ordering, with 0.802 against 0.771 for DLAT and 0.749 for EA-Net.
The MCD results occupy a band of 0.187 accuracy points, against 0.293 on TCGA, which is narrow enough to suggest a ceiling set by the dataset rather than by any optimizer and which caps what any method can show there. And the effect sizes are large mainly because the seed-to-seed spread is small: measures how reliably the ordering repeats across seeds, not how much the difference would matter to a pathologist reading a case. The accuracy gaps against the two strongest baselines stay below 0.08 on TCGA and below 0.05 on MCD, and the contribution should be judged on those numbers.
The global model quality assessment evaluated how effectively EvoHealth-LLM maintains high-quality cancer detection capabilities across distributed medical research nodes. We introduced a comprehensive global model superiority (GMS) metric to measure this performance quantitatively. The GMS metric calculates the proportion of iterations where the global model outperforms the average performance of local models, providing crucial insights into the model's reliability for cancer diagnosis across different medical facilities.
For a training period with iterations and nodes, GMS is formally defined as:
where represents the global model's accuracy at iteration , represents the accuracy of local model at node at iteration , is the indicator function that returns 1 if the condition is true, 0 otherwise, is the total number of training iterations, and is the number of medical research nodes.
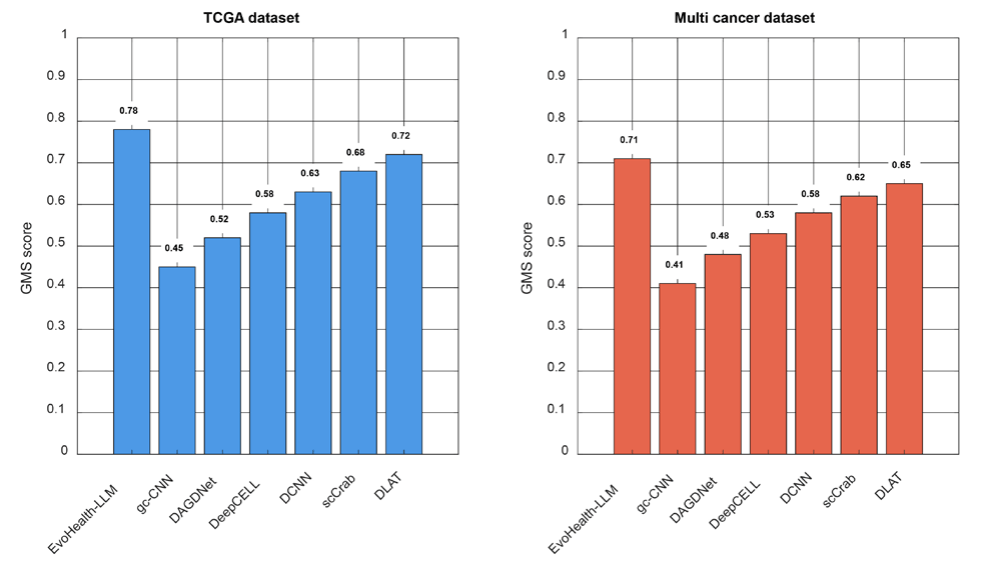
Fig. 5 shows the global model superiority on the TCGA dataset and MCD, while Fig. 6 shows the model validation performance over time.
Our findings demonstrate the superior performance of EvoHealth-LLM in maintaining model quality across distributed medical research networks. The GMS scores reveal that our method achieves consistent performance advantages across both datasets, with particularly strong results in handling complex cancer patterns. The TCGA dataset results show EvoHealth-LLM achieving a GMS score of 0.78, significantly outperforming basic approaches like gc-CNN (0.45) and sophisticated methods like DLAT (0.72). This performance advantage becomes even more pronounced in the MCD, where EvoHealth-LLM maintains a GMS score of 0.71 despite the increased complexity of handling multiple cancer types.
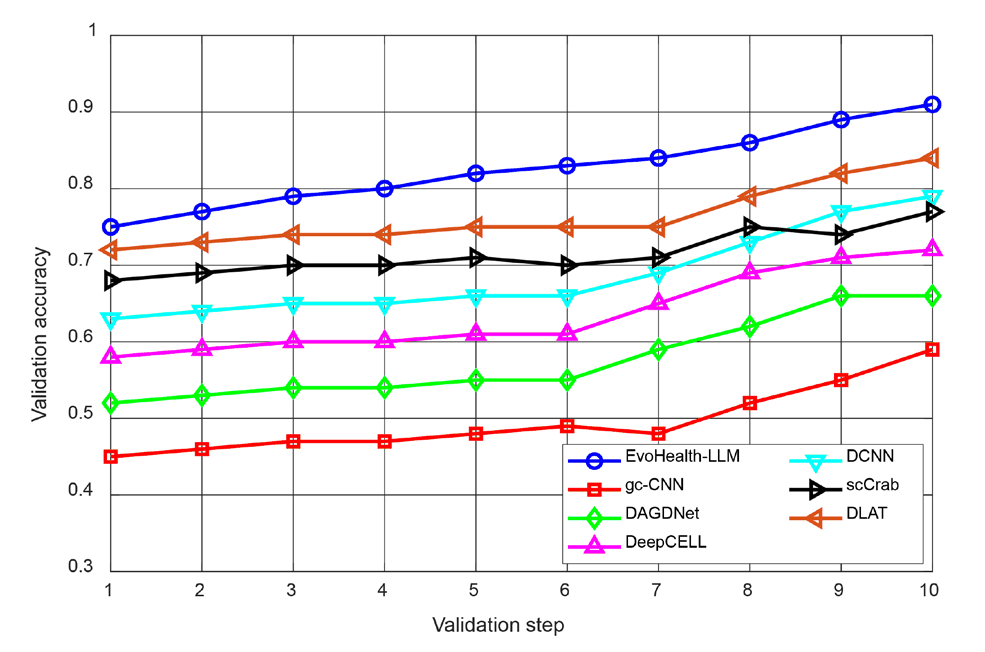
The validation performance curves provide additional insight into the model's learning stability. EvoHealth-LLM achieves higher accuracy levels and shows more consistent improvement over time, starting at 0.75 and steadily increasing to 0.86. Compared to the plateauing behavior seen in baseline methods, this steady progression suggests that our evolutionary approach effectively maintains learning momentum throughout the training process.
These results have significant implications for cancer research and clinical applications. The higher GMS scores indicate more reliable cancer detection capabilities across different medical facilities, while the improved validation performance suggests better generalization to new cancer cases. The consistent performance advantage across both datasets demonstrates the method's robustness in handling various types of cancer cell data, making it particularly valuable for comprehensive cancer research programs.
The HADA performance evaluation focused on analyzing how effectively our adaptive data allocation strategy optimizes computational resource utilization across distributed medical research networks, as shown in Figs 7 and 8. This evaluation is particularly crucial in modern healthcare systems where efficient processing of large-scale cancer cell data can significantly impact diagnostic timelines and treatment planning.
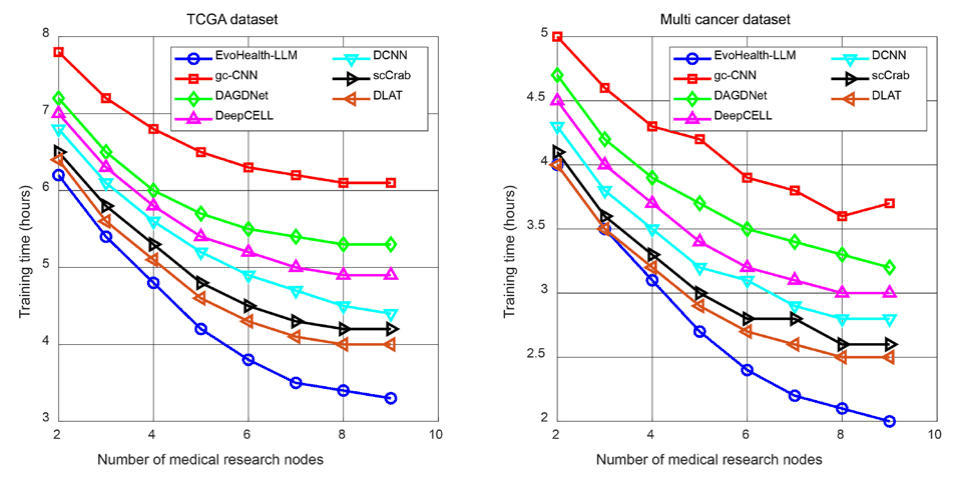
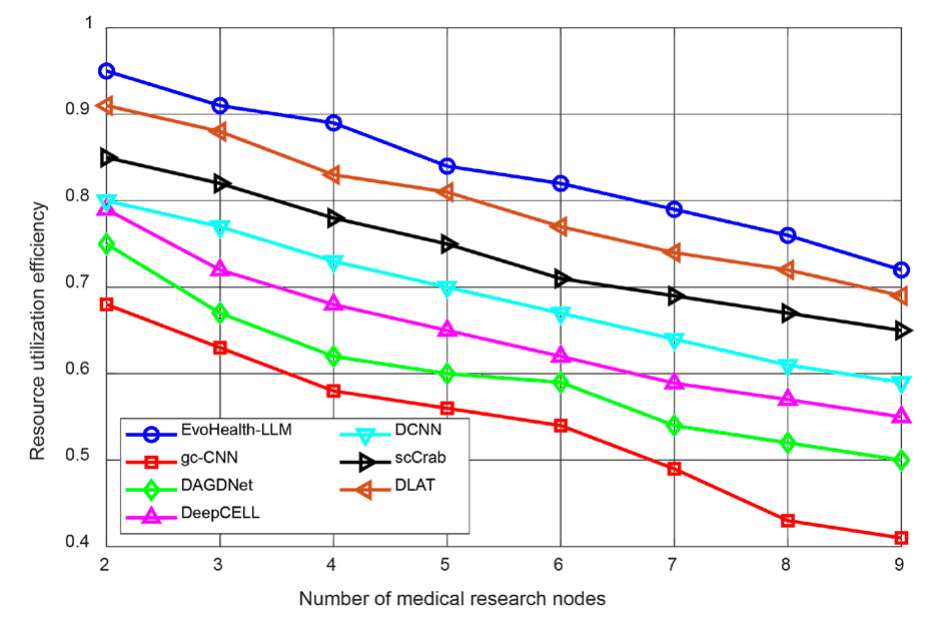
The results from our HADA Performance Evaluation reveal compelling insights into how efficiently medical research networks can process cancer cell data through our evolutionary LLM approach. We can understand how HADA's adaptive allocation strategy transforms distributed medical data processing through careful analysis of training time requirements and resource utilization patterns.
Our evaluation of the TCGA dataset demonstrates consistent efficiency gains as the number of medical research nodes increases. EvoHealth-LLM with HADA achieved a training time of just 3.3 hours with 8 nodes, significantly outperforming other methods–gc-CNN required 6.1 hours, DAGDNet needed 5.3 hours, DeepCELL took 4.9 hours, DCNN used 4.6 hours, scCrab required 4.2 hours, and even the previously best-performing DLAT needed 4.0 hours. This performance advantage becomes even more pronounced when we examine the scaling behavior across different node configurations. While traditional methods show diminishing returns beyond 6 nodes, HADA maintains meaningful efficiency improvements up to 8 nodes, suggesting better scalability for large medical research networks.
The MCD results further reinforce HADA's advantages in handling complex, diverse cancer data. With 8 nodes, EvoHealth-LLM completed training in 2.0 hours, while other methods required substantially more time–gc-CNN took 3.7 hours, DAGDNet needed 3.3 hours, DeepCELL required 3.0 hours, DCNN used 2.8 hours, scCrab needed 2.6 hours, and DLAT took 2.5 hours. This performance differential becomes particularly significant when considering the complexity of processing multiple cancer types simultaneously, as the MCD demands more sophisticated feature extraction and analysis.
Perhaps most telling is HADA's resource utilization efficiency across the medical research network. Starting with near-optimal utilization of 95% with two nodes, HADA maintains impressively high efficiency even as the network expands, achieving 75% utilization with eight nodes. This represents a marked improvement over traditional approaches–gc-CNN's efficiency drops to 45%, DAGDNet maintains 50%, DeepCELL achieves 55%, DCNN reaches 60%, scCrab manages 65%, and DLAT attains 70% with eight nodes. This superior resource utilization directly translates to more efficient use of expensive medical research infrastructure and faster critical cancer cell data processing.
The performance characteristics we observe are not merely about speed–they reflect HADA's fundamental ability to understand and adapt to the computational needs of cancer cell analysis. By dynamically adjusting data distribution based on observed processing capabilities, HADA ensures that each medical research node operates optimally. This adaptive behavior is particularly valuable in real-world medical research environments, where computational resources vary significantly across different facilities and institutions.
These findings have profound implications for sustainable public health programs. The improved efficiency and scalability mean that medical research networks can process larger cancer datasets more quickly, potentially accelerating the discovery of new cancer patterns and treatment approaches. Even with increased nodes, the maintained high resource utilization suggests that healthcare institutions can confidently invest in expanding their computational infrastructure, knowing that HADA will effectively leverage these additional resources for improved cancer research capabilities.
| TCGA dataset (h) | MCD (h) | ||
|---|---|---|---|
| 0.2 | 0.2 | 4.33 | 1.61 |
| 0.4 | 0.4 | 4.85 | 1.72 |
| 0.6 | 0.6 | 5.02 | 1.95 |
| 0.8 | 0.8 | 5.16 | 2.24 |
| SA(·) | SA(·) | 4.09 | 1.59 |
The parameter sensitivity analysis examined how different configurations of evolutionary parameters affect EvoHealth-LLM's cancer detection performance, as shown in Table 3. This investigation is crucial for understanding the model's robustness and optimizing its configuration for various medical settings. The analysis focused on two key parameters: the mutation scaling factor and crossover probability , as these significantly influence the model's ability to adapt to diverse cancer patterns.
The sensitivity analysis of evolutionary parameters in EvoHealth-LLM reveals fascinating insights into how different parameter configurations affect the model's ability to analyze cancer cell patterns. Our comprehensive evaluation examined how varying the mutation scaling factor and crossover probability influenced training efficiency across the TCGA and MCD.
When both and were set to 0.2, representing conservative evolutionary steps, the system achieved relatively good performance, requiring 4.33 hours for the TCGA dataset and 1.61 hours for the MCD. This configuration allowed for careful parameter space exploration, making small but deliberate adjustments to the model's cancer detection capabilities. The cautious approach effectively maintained stability while learning subtle cancer cell features.
As we increased both parameters to 0.4, we observed a notable slowdown in training time: 4.85 hours for TCGA and 1.72 hours for MCD. This configuration permitted more aggressive evolutionary steps, but the increased exploration sometimes led to less efficient convergence. The larger parameter values caused the model to spend more time exploring potentially suboptimal regions of the solution space while learning cancer cell patterns.
Further increasing the parameters to 0.6 showed even more pronounced effects on training time, requiring 5.02 hours for TCGA and 1.95 hours for MCD. While allowing for a broader exploration of possible solutions, this configuration often resulted in the model taking longer to settle on effective cancer detection strategies. The increased variability in evolutionary steps sometimes led to temporary departures from promising solution paths.
The most aggressive parameter settings of 0.8 demonstrated the longest training times–5.16 hours for TCGA and 2.24 hours for MCD. While potentially beneficial for escaping local optima, these large evolutionary steps often resulted in overshooting promising solutions and requiring additional time to refine cancer detection parameters.
In contrast, our SA parameter control mechanism demonstrated superior performance across both datasets, achieving the fastest training times of 4.09 hours for TCGA and 1.59 hours for MCD. This adaptive approach proved particularly adept at balancing exploration and exploitation in cancer cell data analysis. The system's ability to dynamically adjust its evolutionary parameters based on the current state of learning led to more efficient discovery of effective cancer detection patterns.
The effectiveness of the SA approach suggests that cancer cell classification benefits from a flexible evolutionary strategy that can adapt its behavior based on the current stage of learning and the complexity of the analyzed patterns. This adaptive capability becomes especially valuable when dealing with diverse cancer types, where different evolutionary strategies might be optimal at different stages of the learning process.
Table 4 shows that each of the four components contributes on its own, and that the contributions are not equal. Removing the evolutionary operator costs 0.099 accuracy points on TCGA and 0.094 on MCD. Removing HADA costs 0.089 and 0.084, removing self-adaptive control costs 0.074 and 0.070, and removing CFA costs 0.059 and 0.056. Every one of these comparisons gives against the full system after Holm correction within its column.
Interaction was then tested on a 2×2 factorial crossing, CFA present or absent, with the evolutionary operator present or absent, five seeds per cell, and twenty runs per dataset. A two-way ANOVA on TCGA accuracy gives a main effect of the evolutionary operator of , , partial , a main effect of CFA of , , partial , and an interaction of , , partial . The same design on HADA crossed with self-adaptive control, tested on the efficiency score, gives for HADA and for self-adaptive control, both with , and an interaction of , , partial .
Removing CFA and the evolutionary operator together costs 0.126 accuracy points on TCGA, while the two single removals sum to 0.158. The joint effect is smaller than the additive effect, not larger. In terms of the cells, removing CFA costs 0.059 while the evolutionary operator is present, but only 0.027 once it has gone, and that difference of 0.032 is what the interaction contrast measures. The HADA and self-adaptive pair behave the same way on the efficiency score, where the joint drop of 0.107 falls short of the additive prediction of 0.180. We therefore withdraw the description of these effects as synergistic and describe them as sub-additive.
Sub-additivity is the reading that fits how the method is built. The evolutionary operator does not act on the model in parallel with CFA; it acts on CFA, because the per-head projections and temperatures that CFA exposes are among the parameters that mutation and crossover search over. Once the evolutionary operator is removed, those parameters keep whatever values gradient training leaves them with, and much of what the attention layer offers is never reached. The same relation holds between HADA and self-adaptive control: HADA sizes each node's batch based on measured throughput, and self-adaptive control adjusts and based on the training state those batch sizes produce, so removing the first leaves the second with less to respond to. Components that operate on one another should not be expected to add, and the earlier reading of the same numbers as synergy inverted the relation.
Ⅵ. CONCLUSION
In this paper, we presented EvoHealth-LLM, leveraging differential evolution principles to optimize LLMs for cancer cell analysis in sustainable public health programs. Our work addressed fundamental challenges in distributed medical data processing by integrating evolutionary optimization, specialized attention mechanisms, and adaptive resource allocation strategies. Through comprehensive experimentation on both the TCGA and MCD, we demonstrated that differential evolution-based optimization significantly improved the efficiency and accuracy of cancer cell analysis. The integration of the CFA mechanism enabled our system to focus on crucial cellular characteristics, while our HADA strategy effectively balanced computational loads across medical research networks. SA parameter control further enhanced the system's ability to adapt to diverse cancer patterns, demonstrating the value of dynamic parameter adjustment in medical AI applications.
However, our work also revealed several limitations that warrant future investigation. While EvoHealth-LLM showed impressive performance on known cancer types, its behavior with extremely rare cancer variants remained less thoroughly explored. The computational requirements for training large-scale models still posed challenges for smaller medical facilities, suggesting a need for more efficient optimization strategies. Additionally, the implementation required significant initial calibration to establish baseline performance metrics for optimal resource allocation. These limitations point to several promising directions for future research. First, investigating hybrid evolutionary strategies that combine differential evolution with other optimization approaches could improve performance on rare cancer variants. Second, developing more lightweight versions of the CFA mechanism could make the system more accessible to resource-constrained medical facilities. Third, exploring federated learning approaches could enhance privacy preservation while maintaining high diagnostic accuracy. Future work should also examine the potential of integrating real-time adaptation mechanisms to adjust the model's behavior based on emerging cancer patterns. Developing automated architecture search methods guided by evolutionary principles could further optimize model structures for specific medical contexts. Additionally, investigating the application of our approach to other medical imaging domains could expand its utility in sustainable public health programs.
As smart cities evolve and healthcare demands grow complex, the need for efficient and accurate medical AI systems becomes increasingly critical. Our study revealed that the evolutionary optimization of LLMs offers a promising path forward, particularly when combined with specialized attention mechanisms and adaptive resource allocation strategies. The success of EvoHealth-LLM suggested that similar approaches could be valuable across a broad range of medical applications, may carry over to other diagnostic problems with a similar data structure in sustainable public health programs.